Pretrained multi-modal large language models (MLLMs) demonstrate strong performance on diverse multimodal tasks, but remain limited in reasoning capabilities for domains where annotations are difficult to collect. In this work, we focus on artificial image domains such as charts, rendered documents, and webpages, which are abundant in practice yet lack large-scale human annotated reasoning datasets.
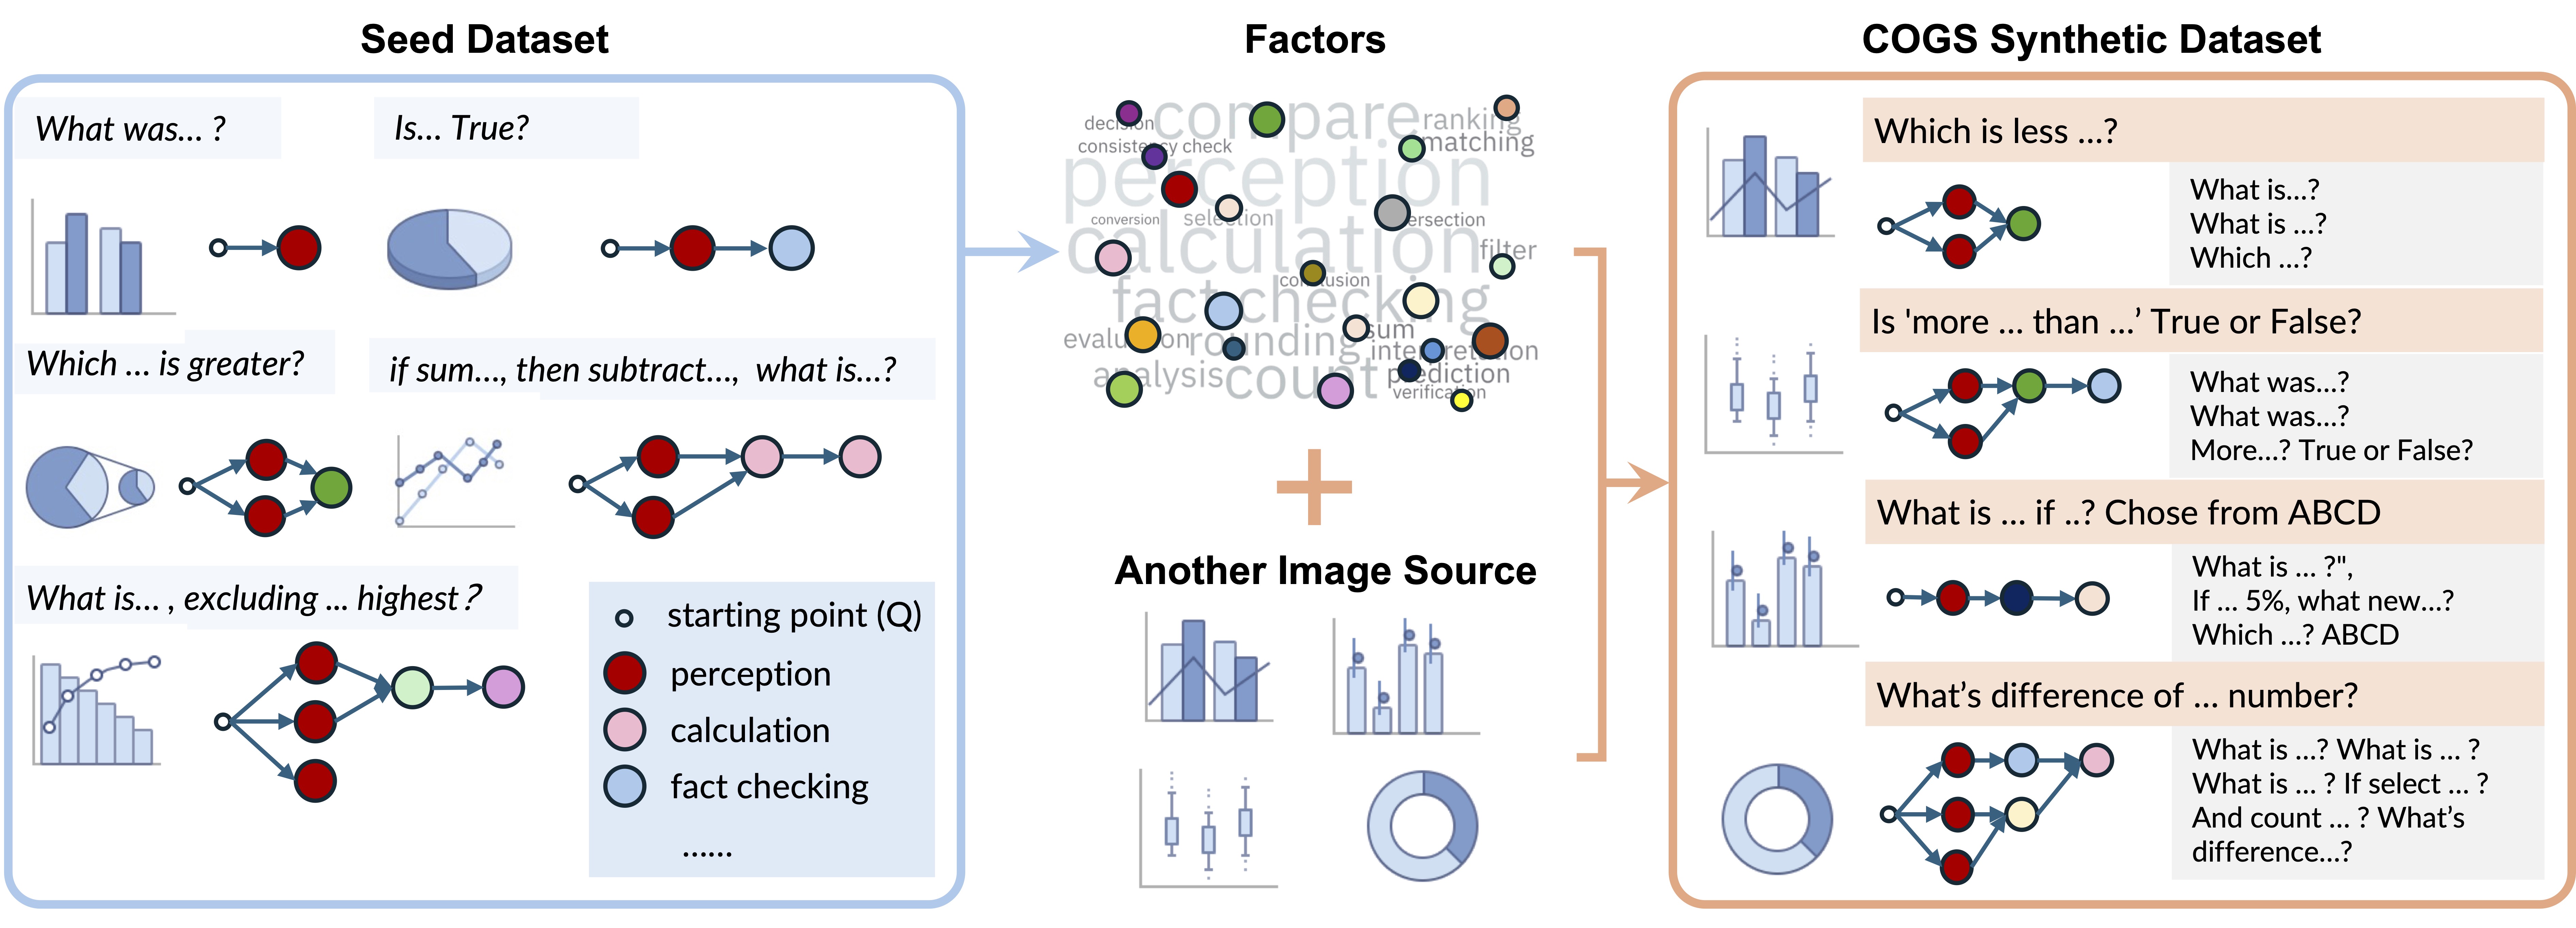
We introduce COGS (COmposition-Grounded data Synthesis), a data-efficient framework for equipping MLLMs with advanced reasoning abilities from a small set of seed questions. The key idea is to decompose each seed question into primitive perception and reasoning factors, which can then be systematically recomposed with new images to generate large collections of synthetic question-answer pairs. Each generated question is paired with subquestions and intermediate answers, enabling reinforcement learning with factor-level process rewards. Experiments on chart reasoning show that COGS substantially improves performance on unseen questions, with the largest gains on reasoning-heavy and compositional questions.
Moreover, training with a factor-level mixture of different seed data yields better transfer across multiple datasets, suggesting that COGS induces generalizable capabilities rather than dataset-specific overfitting. We further demonstrate that the framework extends beyond charts to other domains such as webpages.
COGS operates in 3 stages:
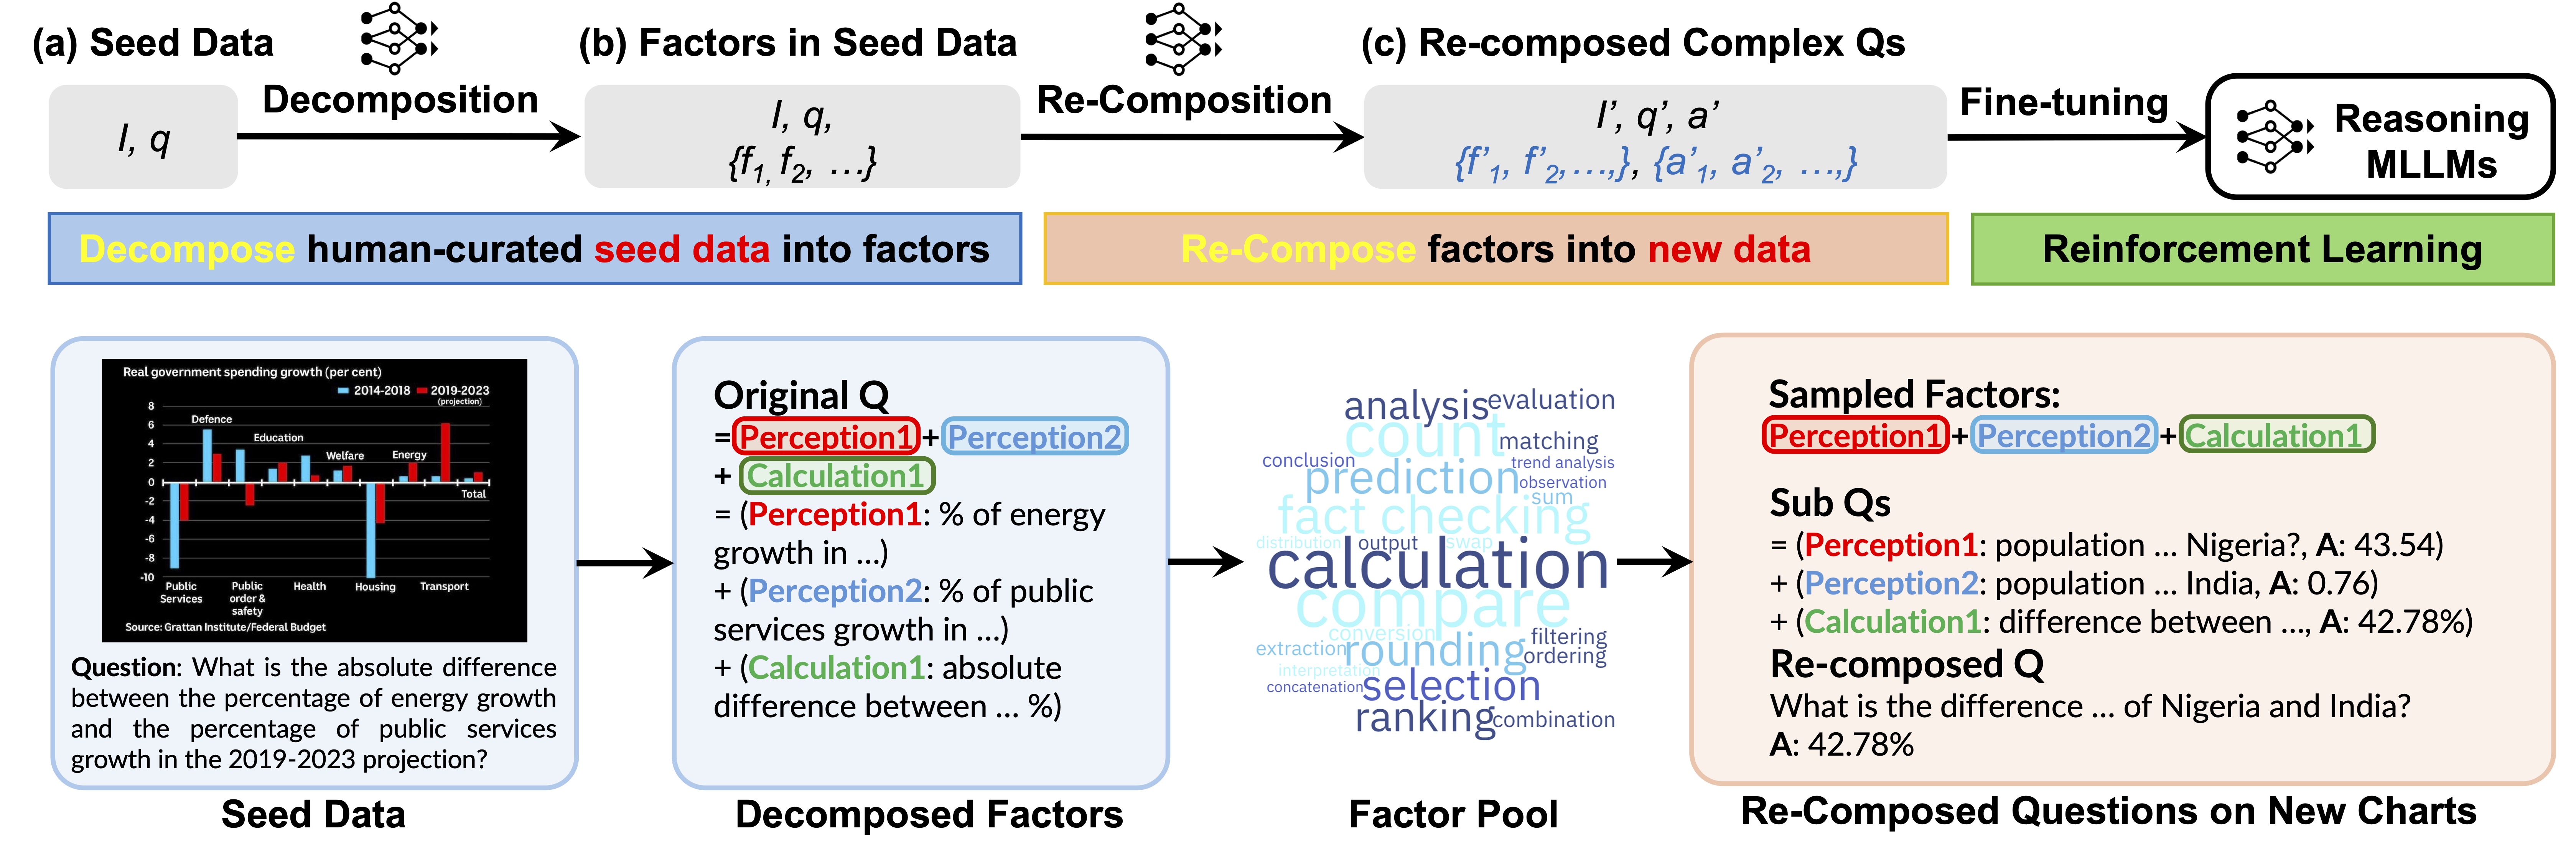
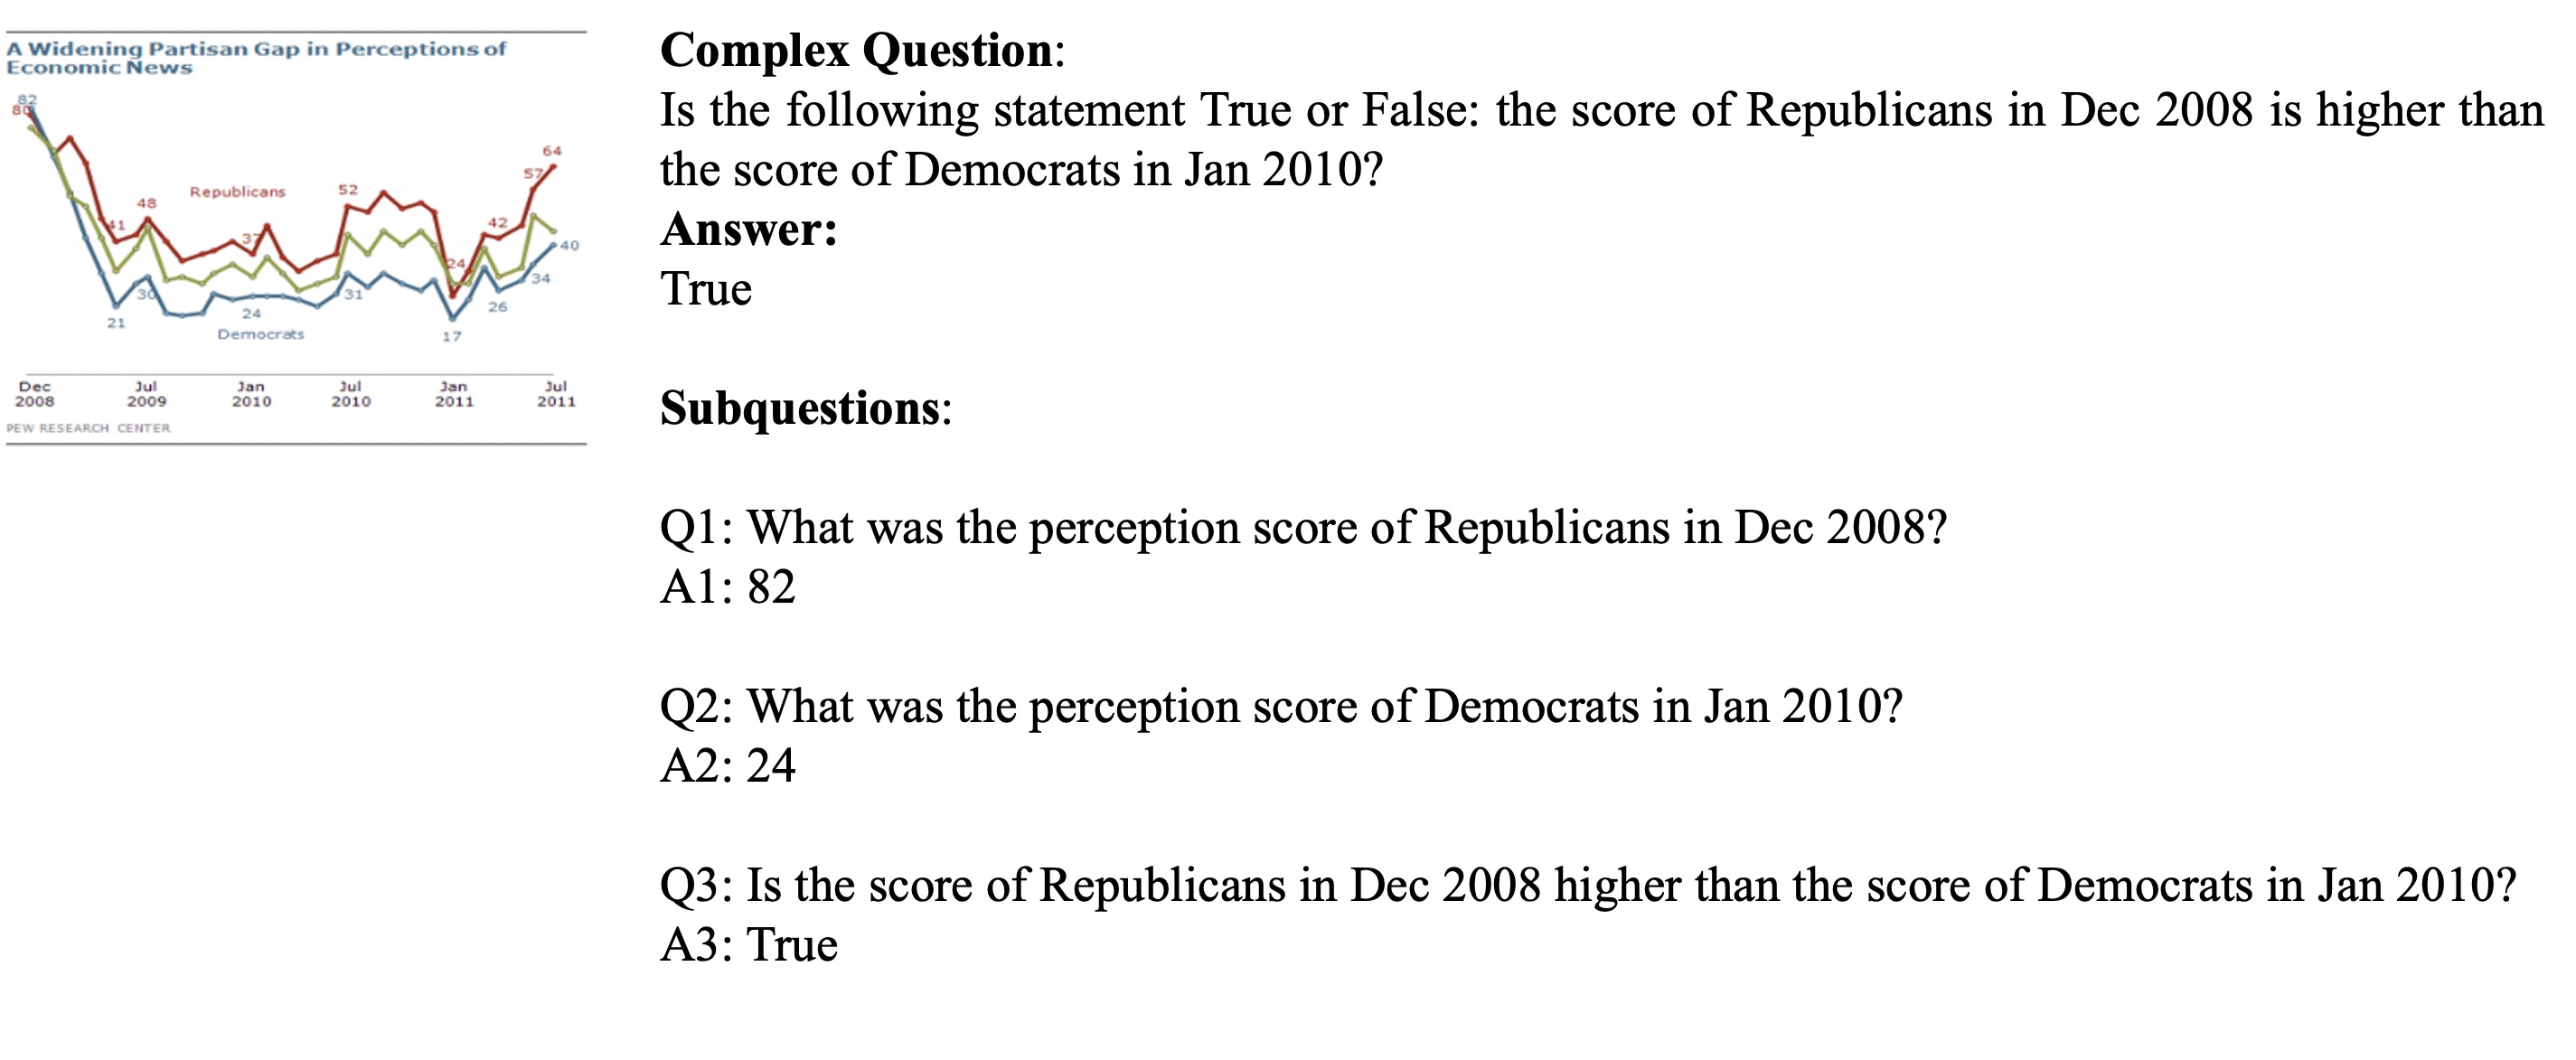
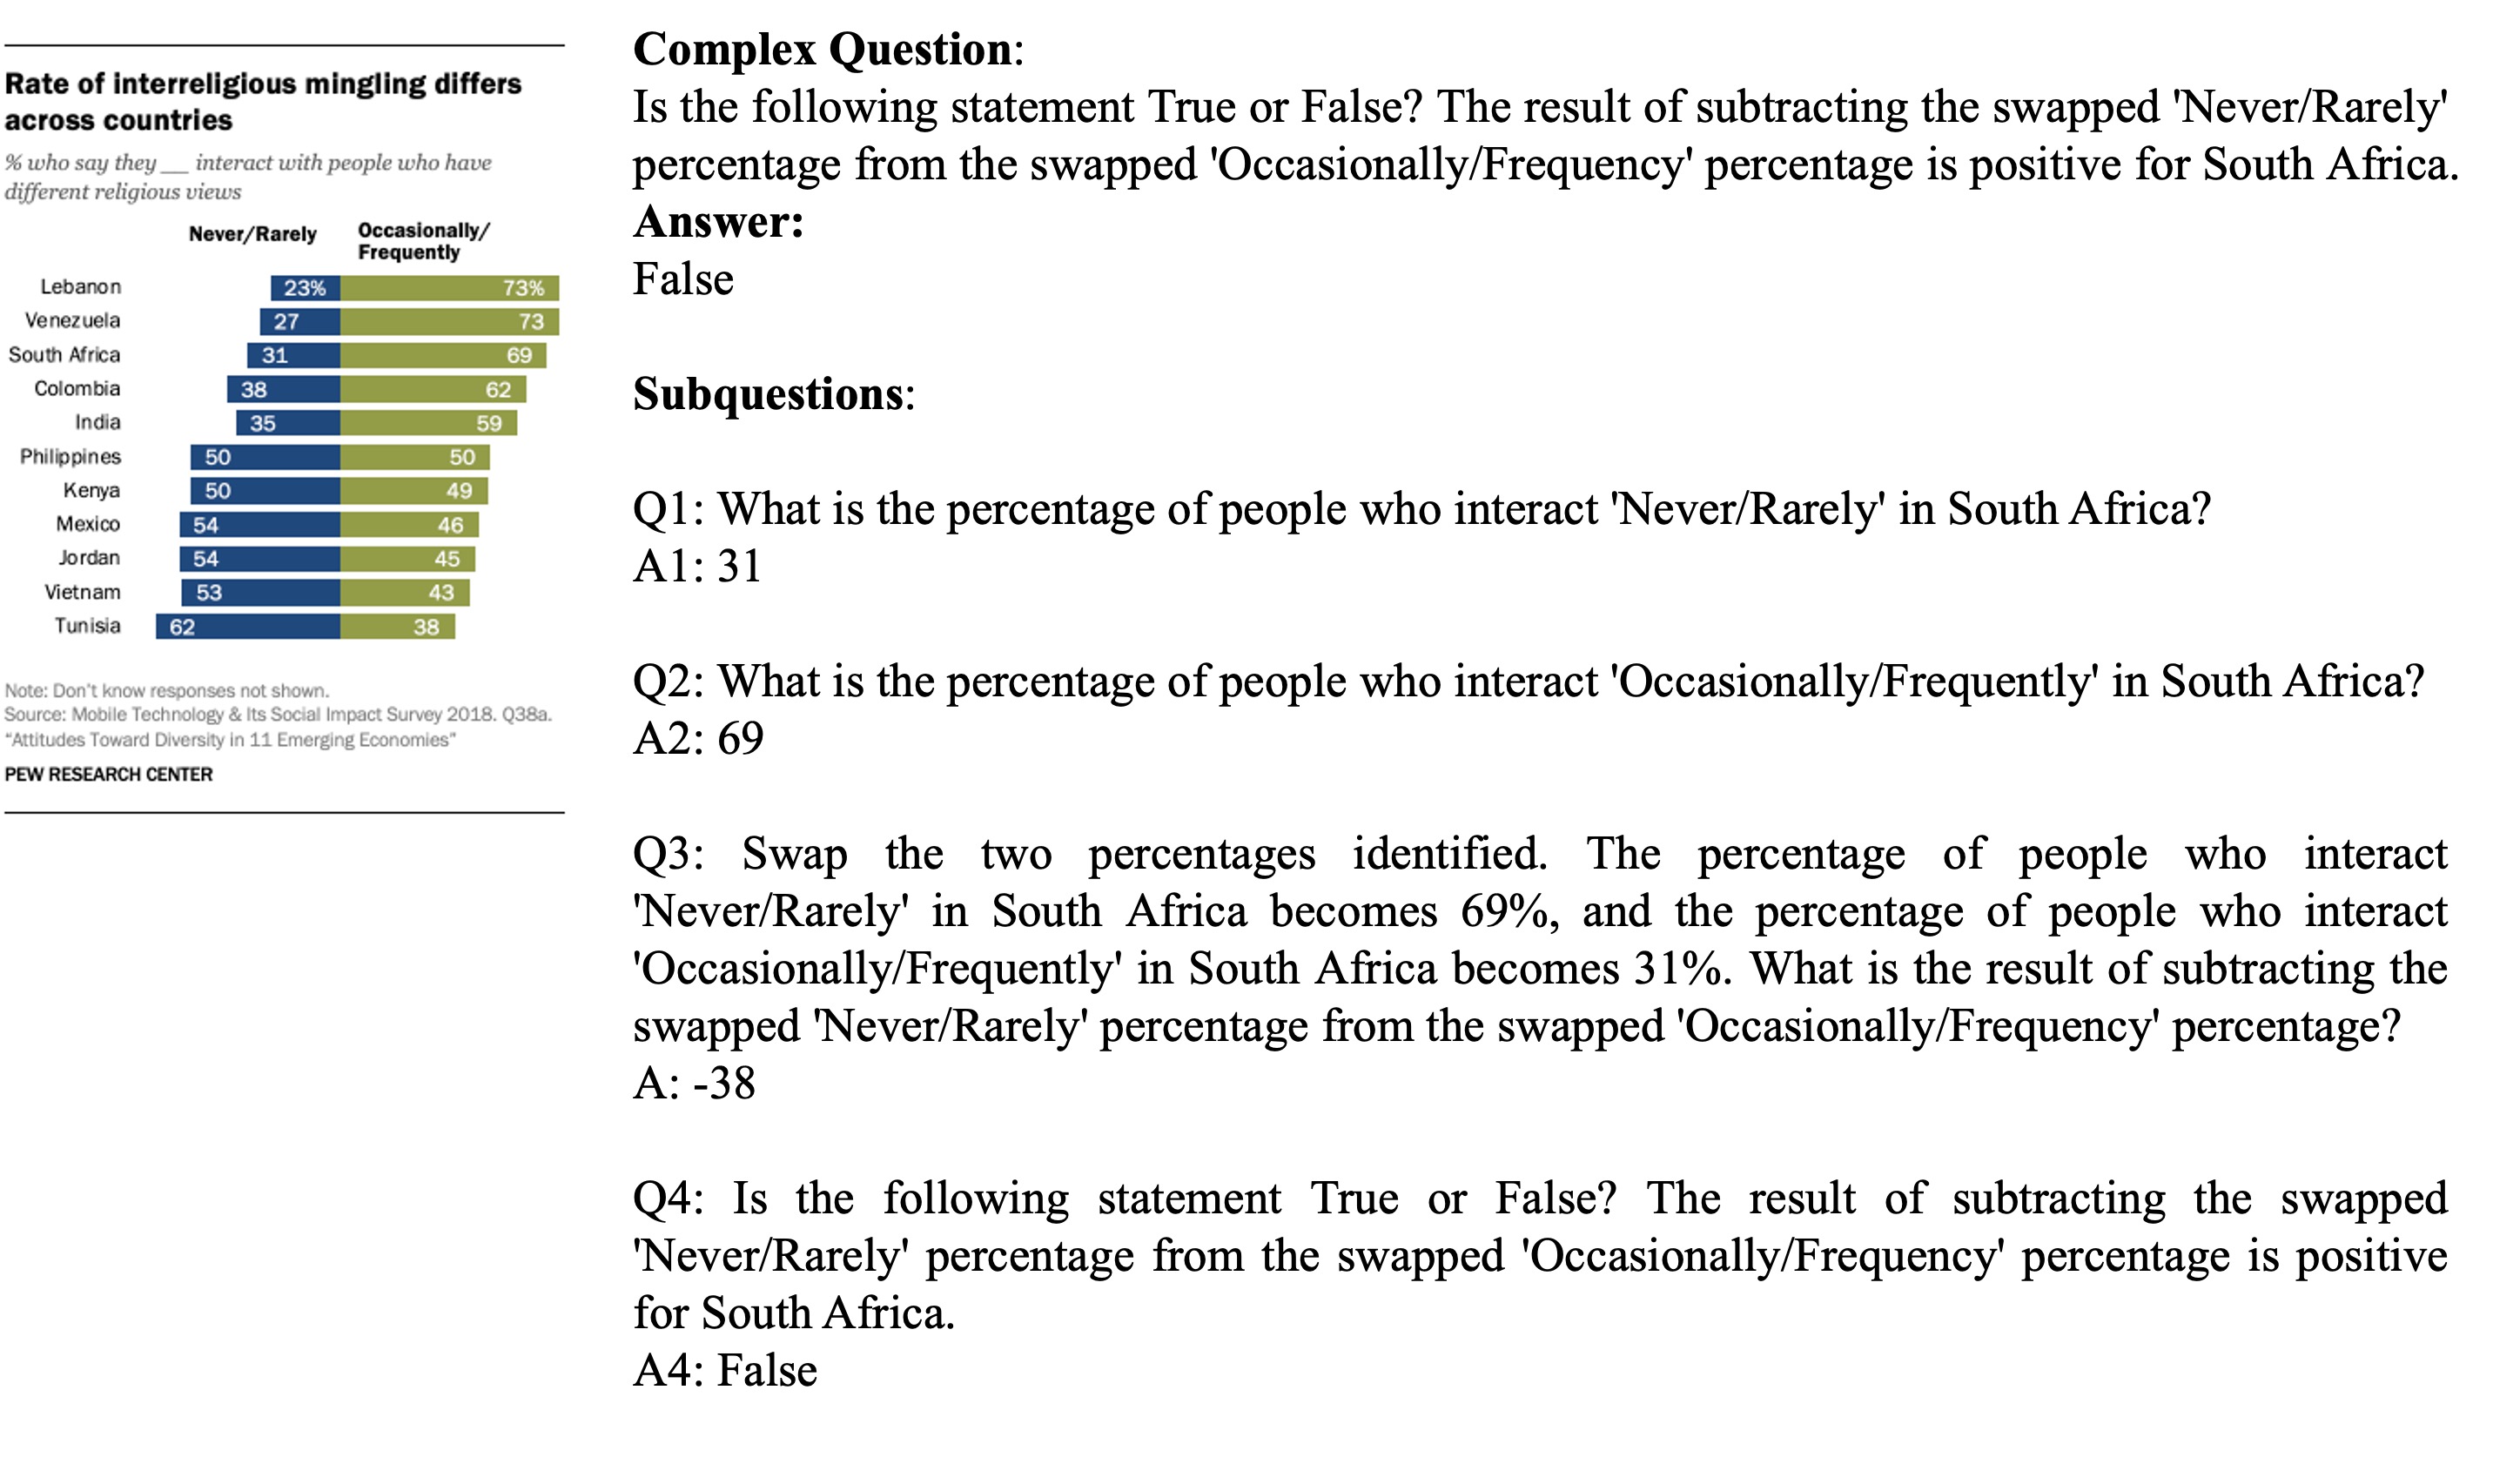
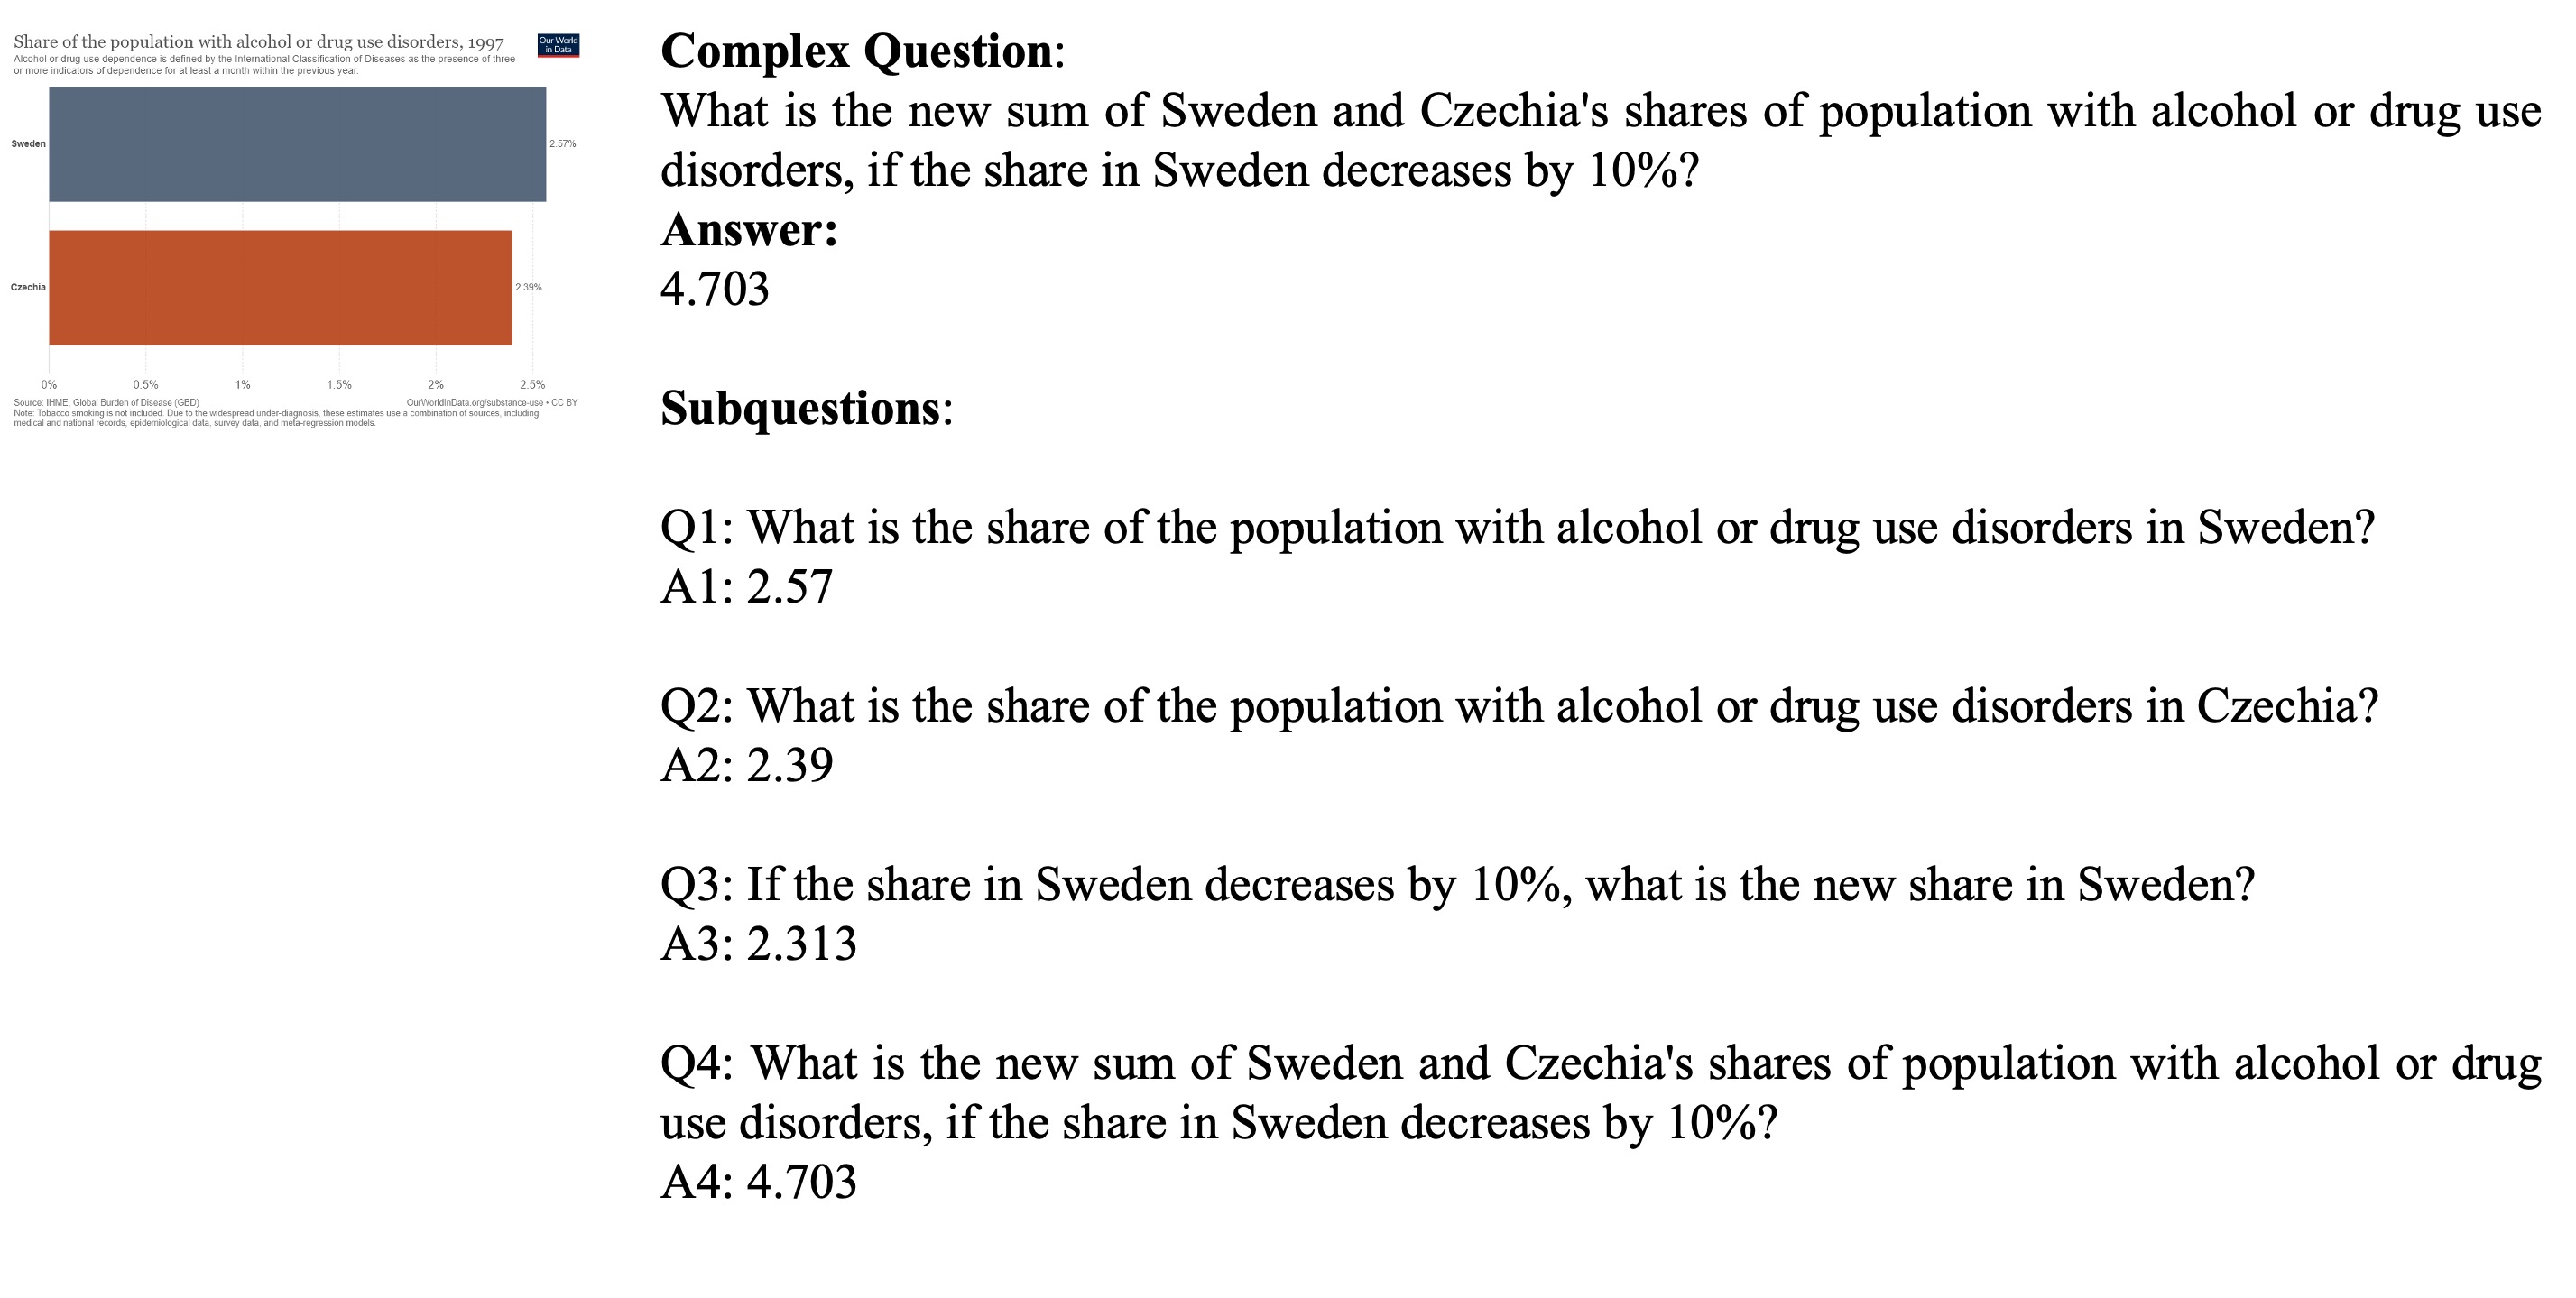
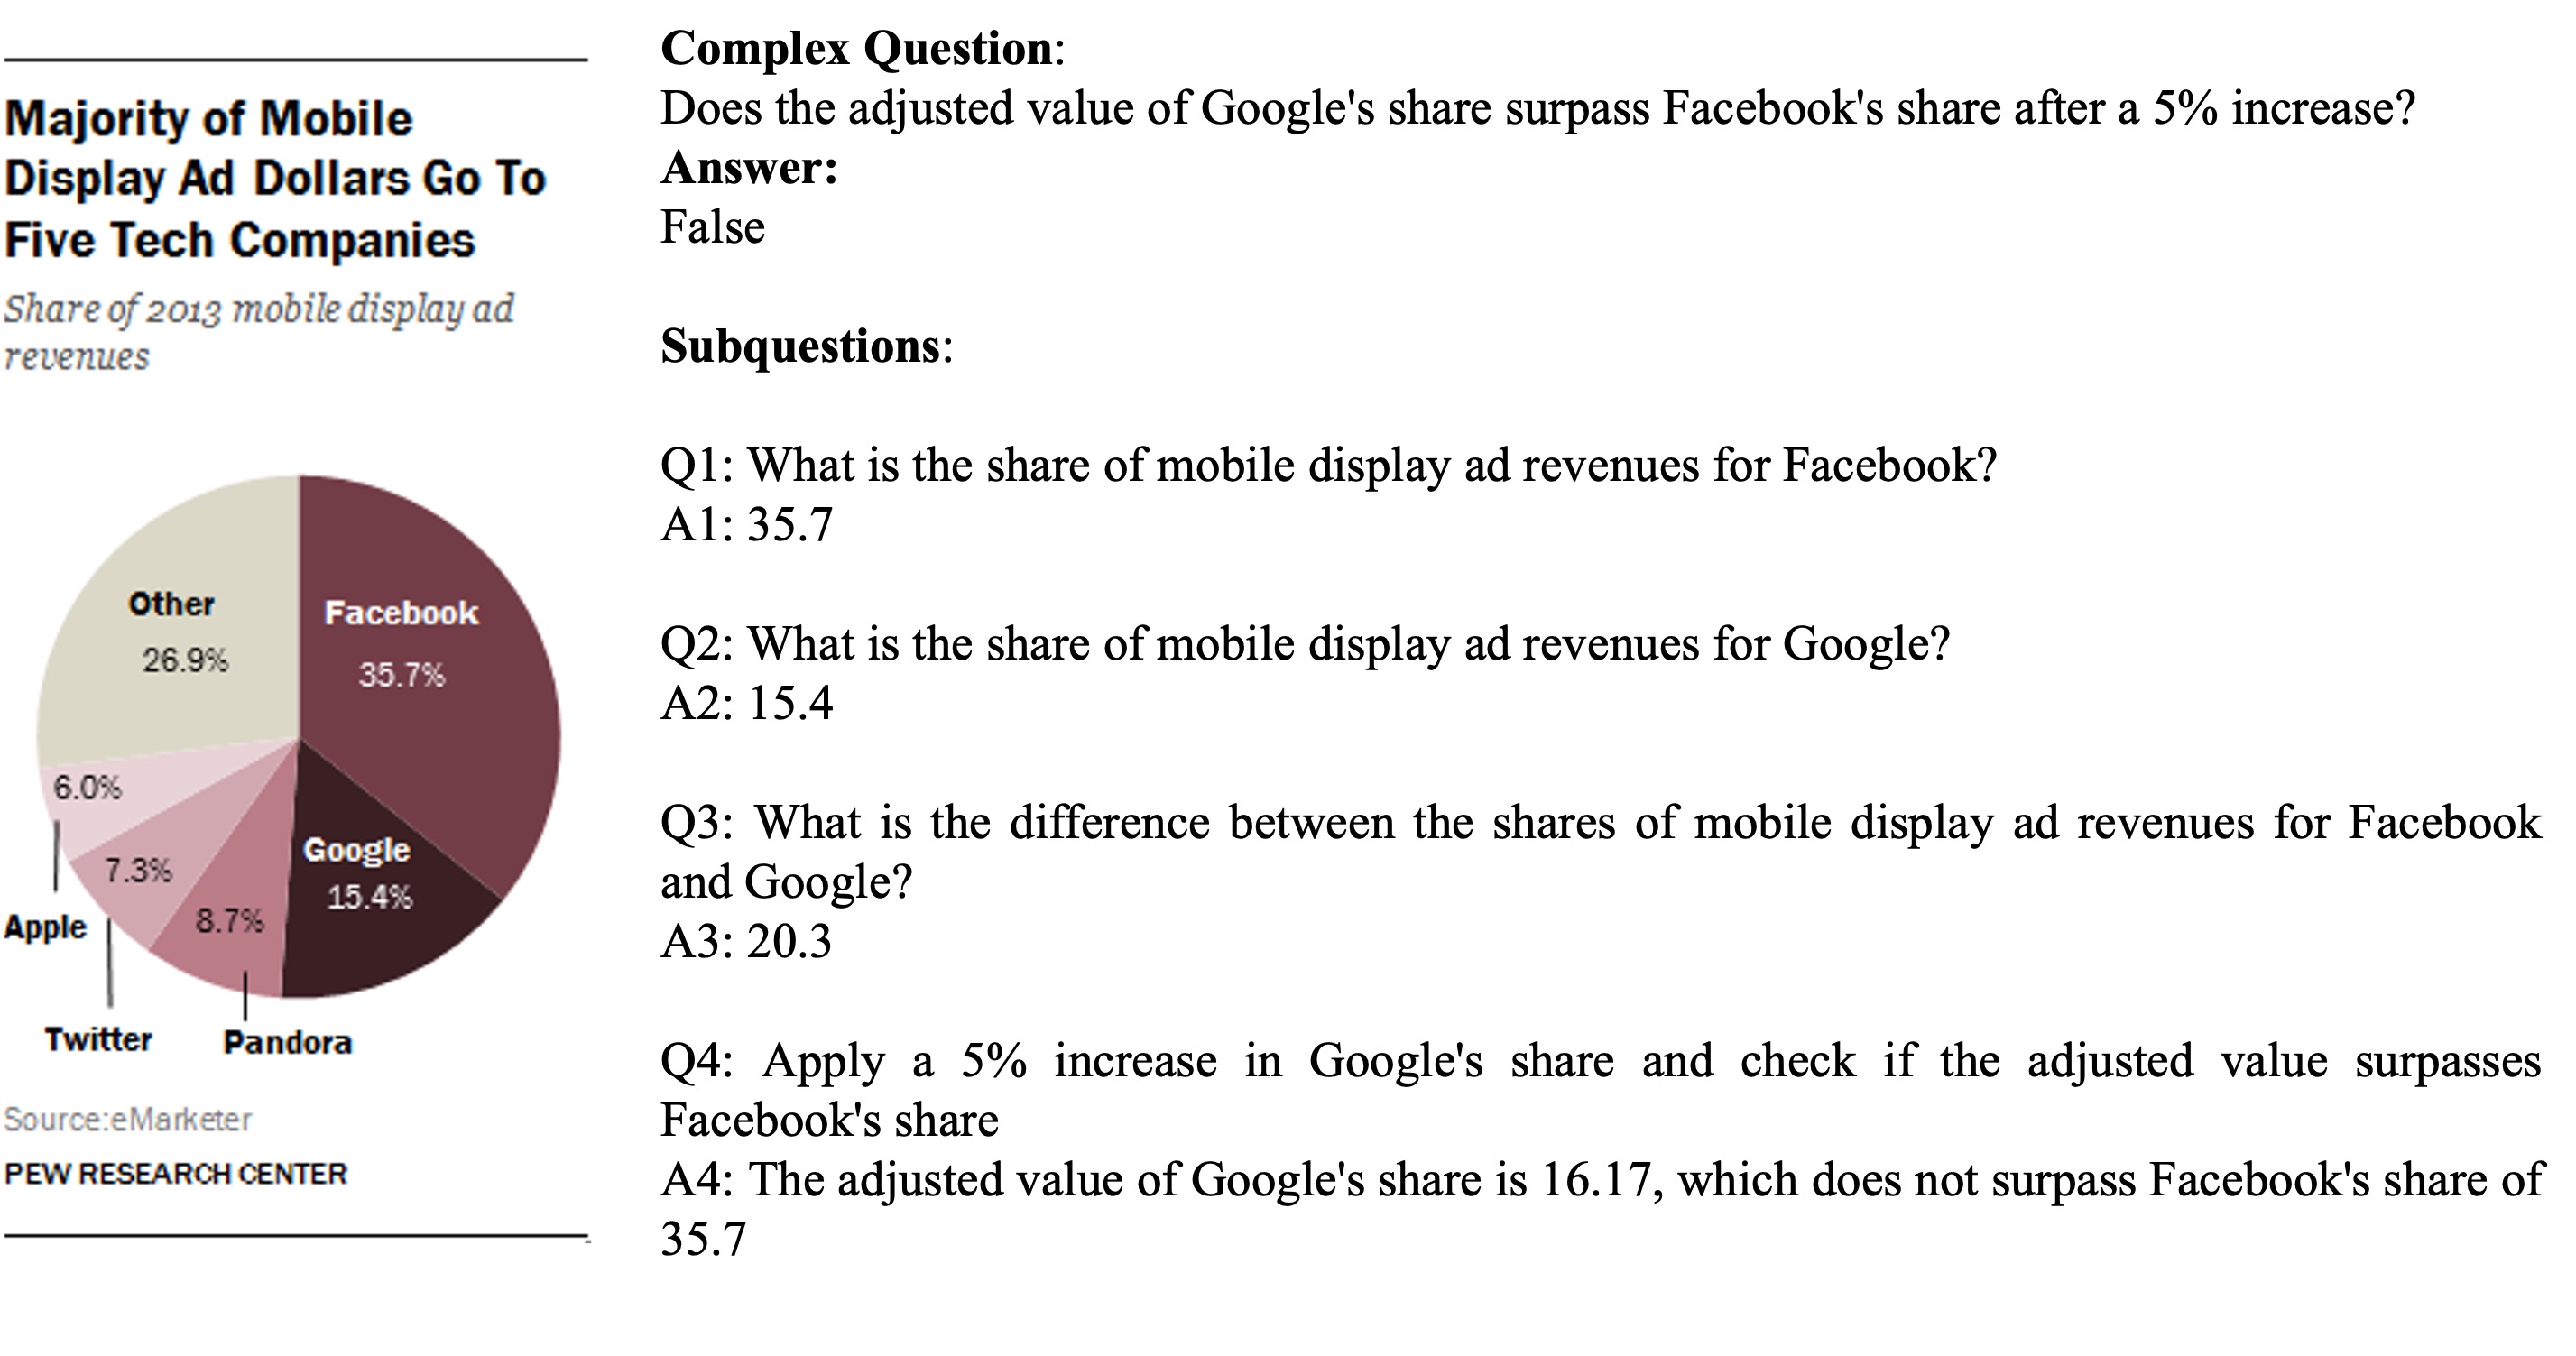
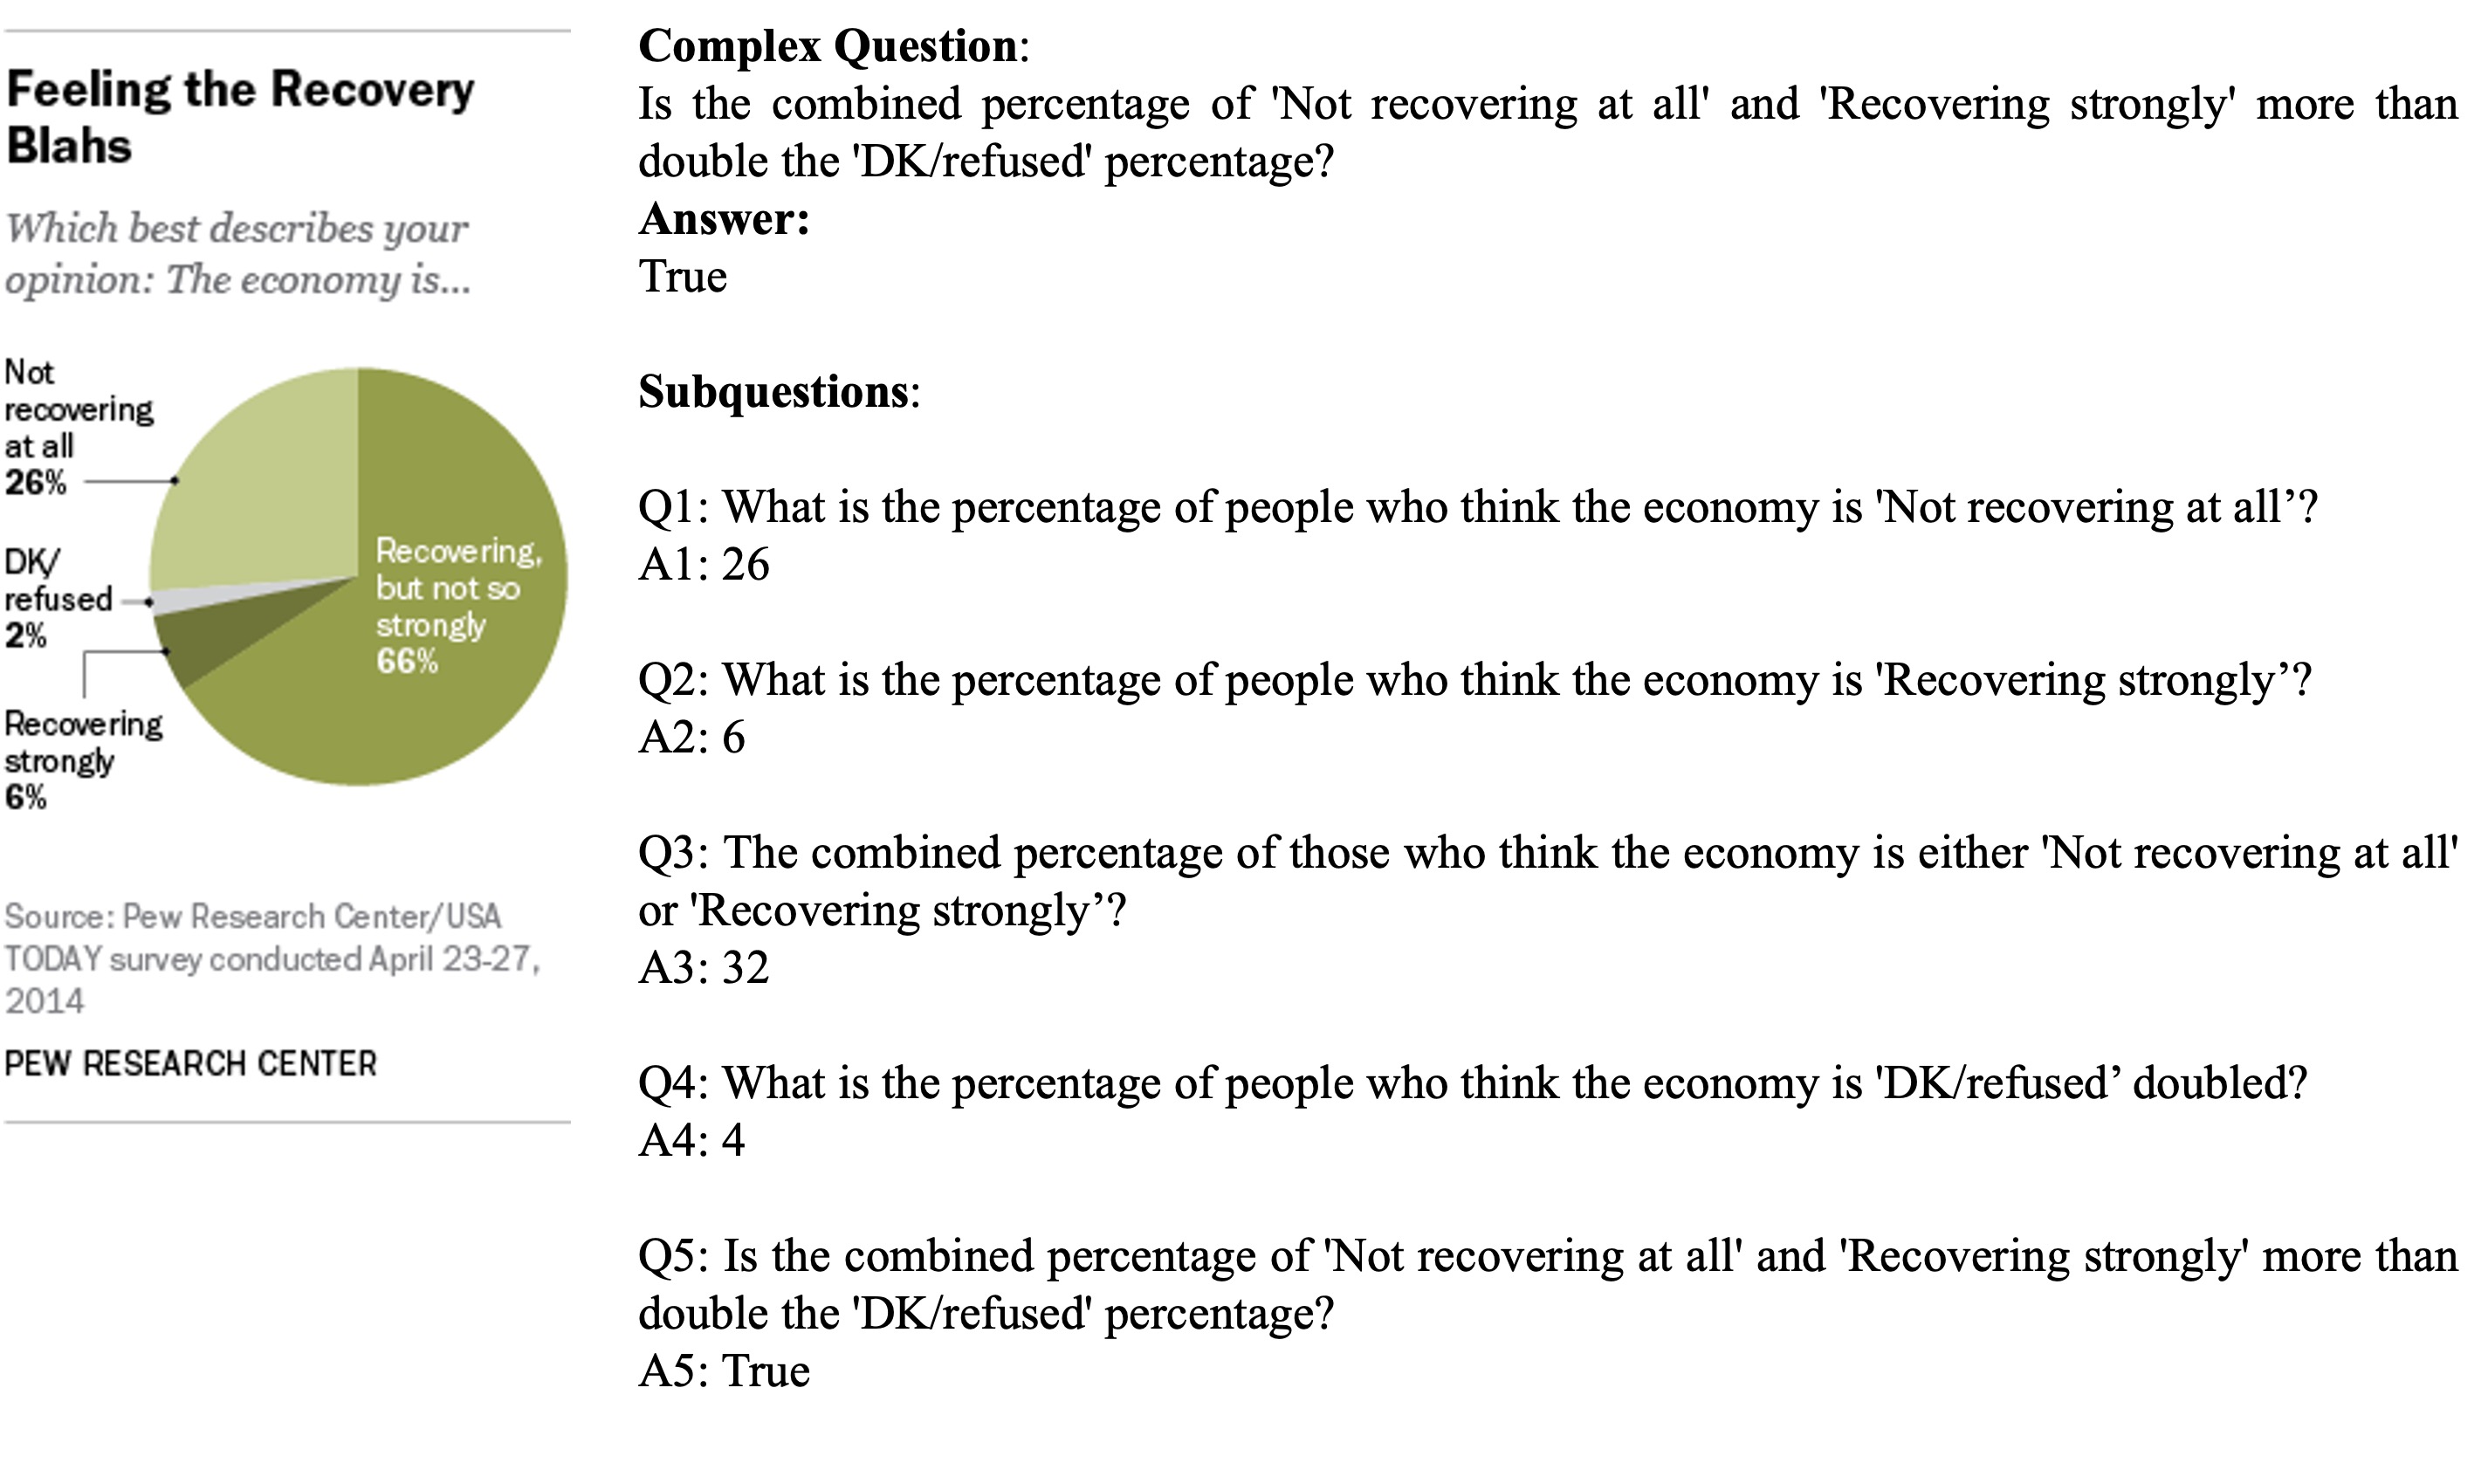
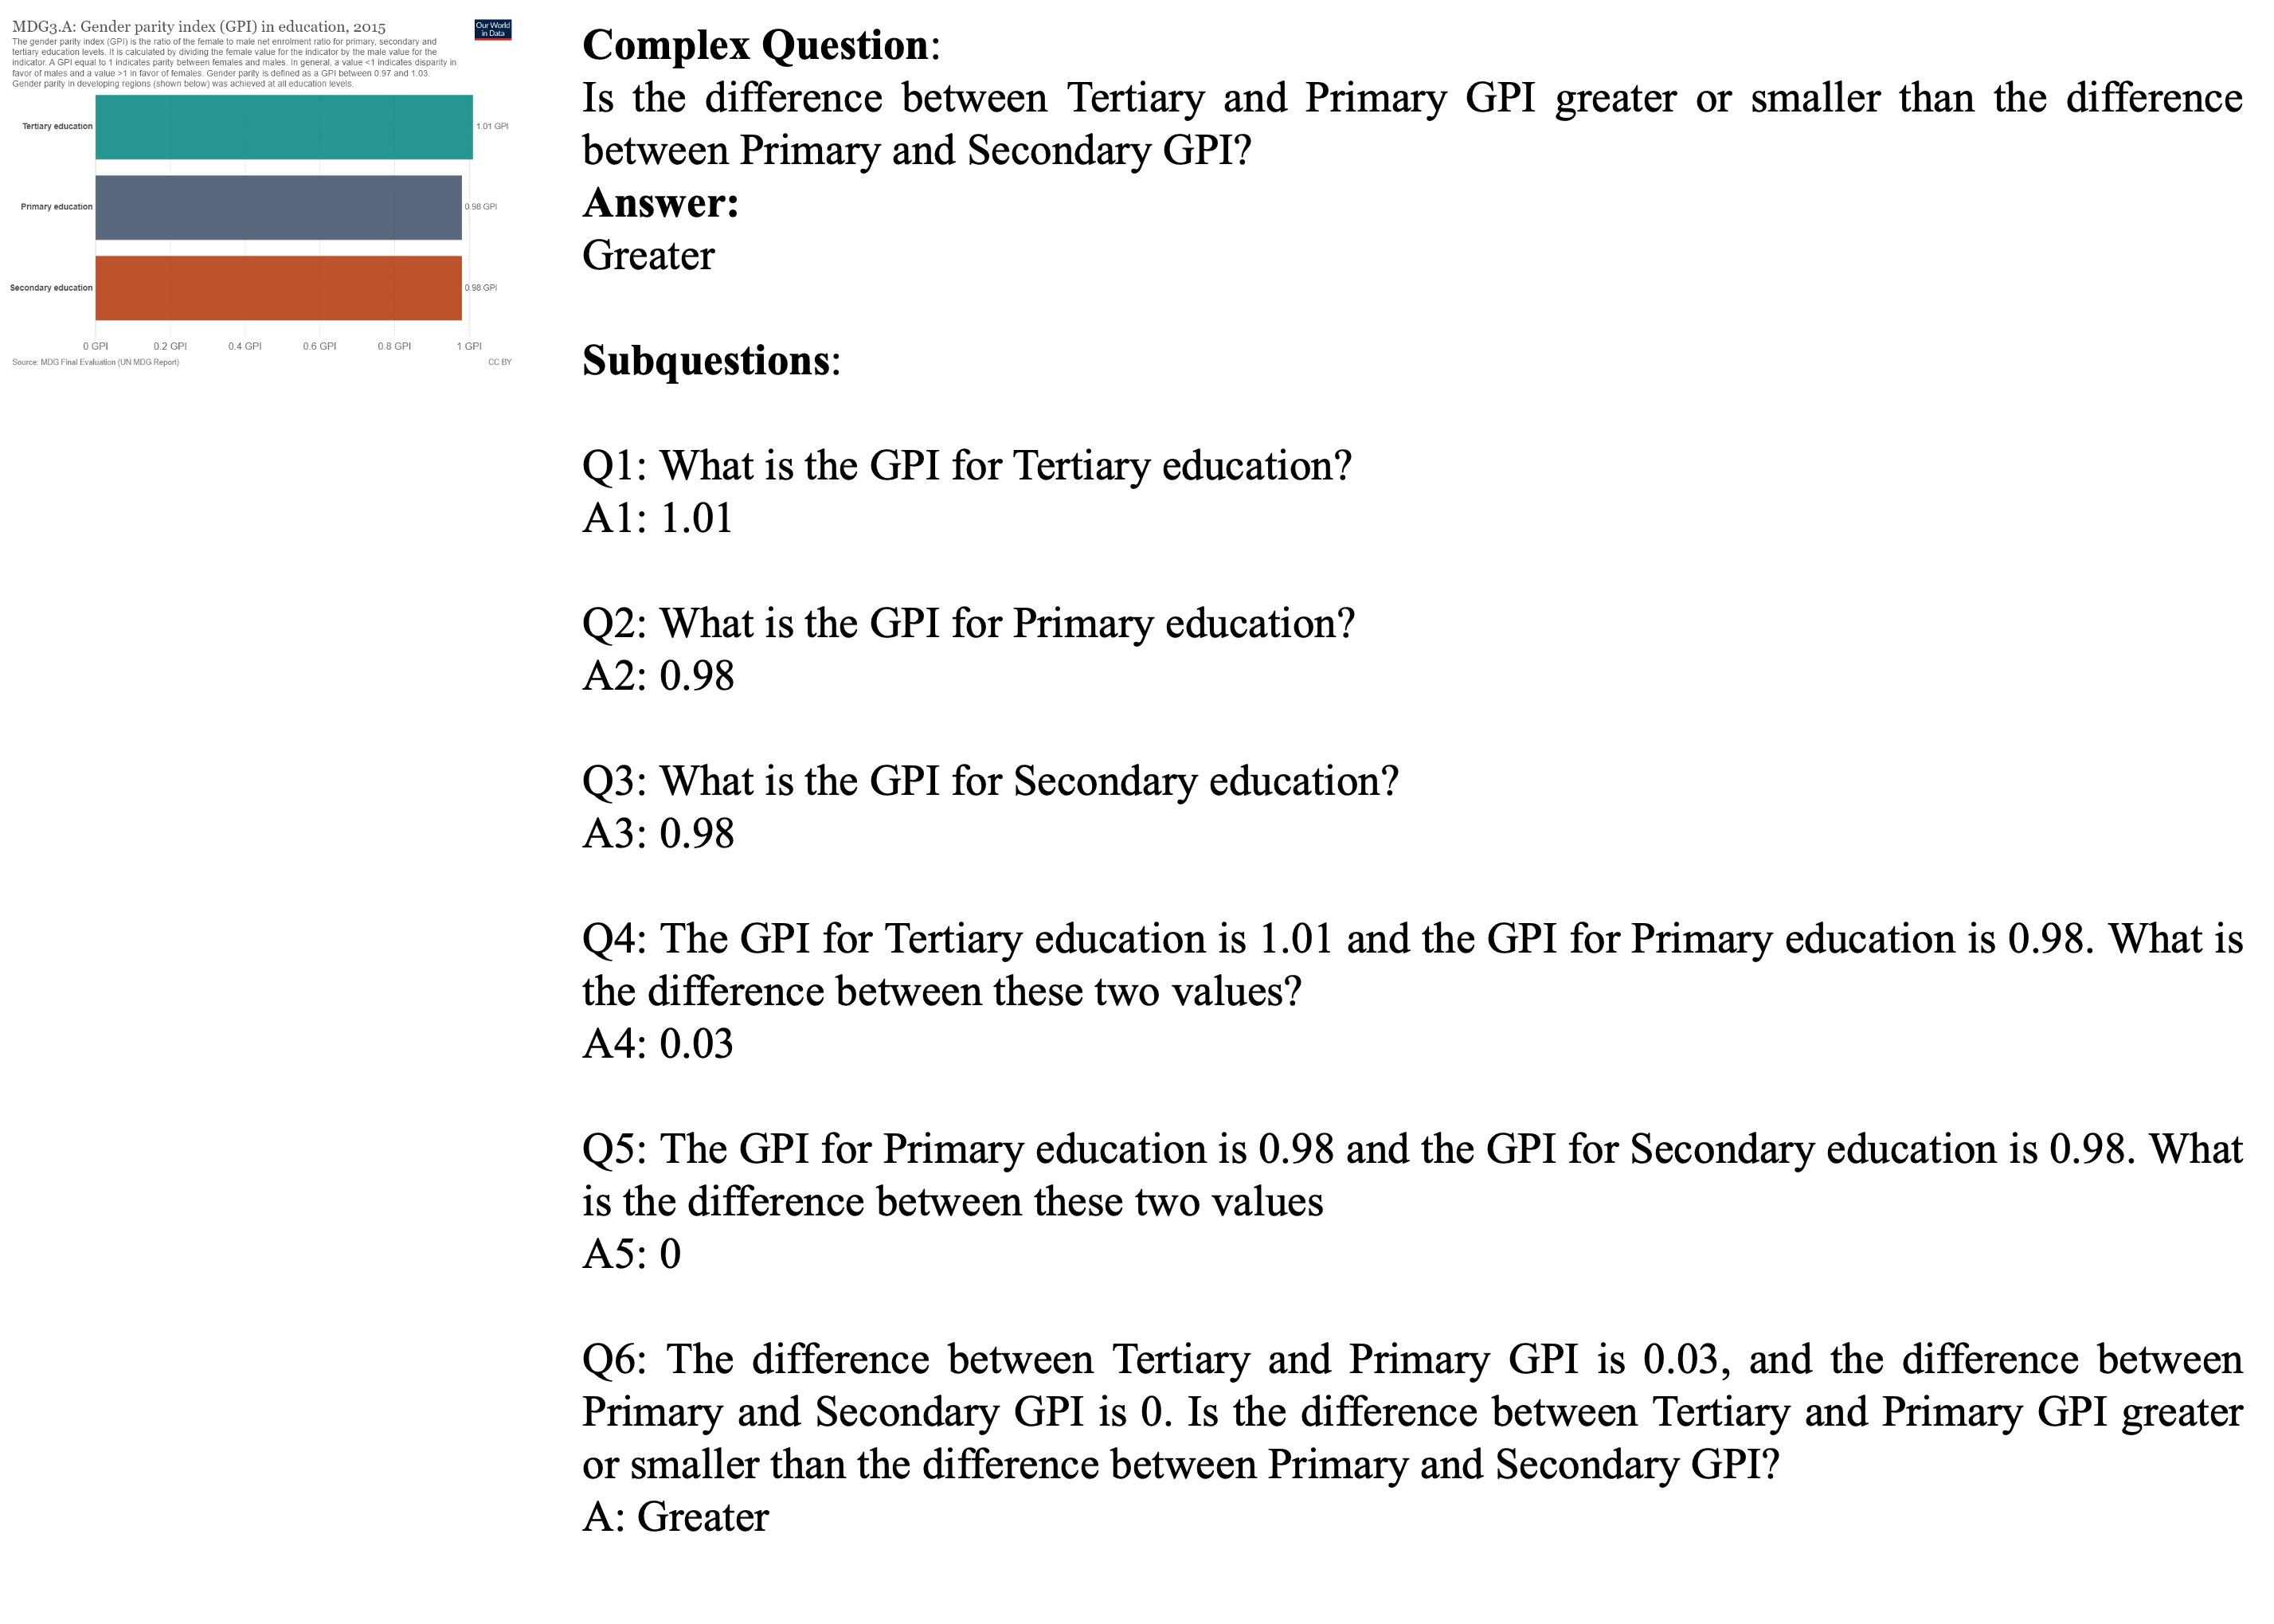
1) Seed Data Decomposition: given a small seed set of complex questions, a multimodal LLM decomposes each question into interpretable perception and reasoning factors. The aggregated factor set captures the seed domain’s compositional structure.
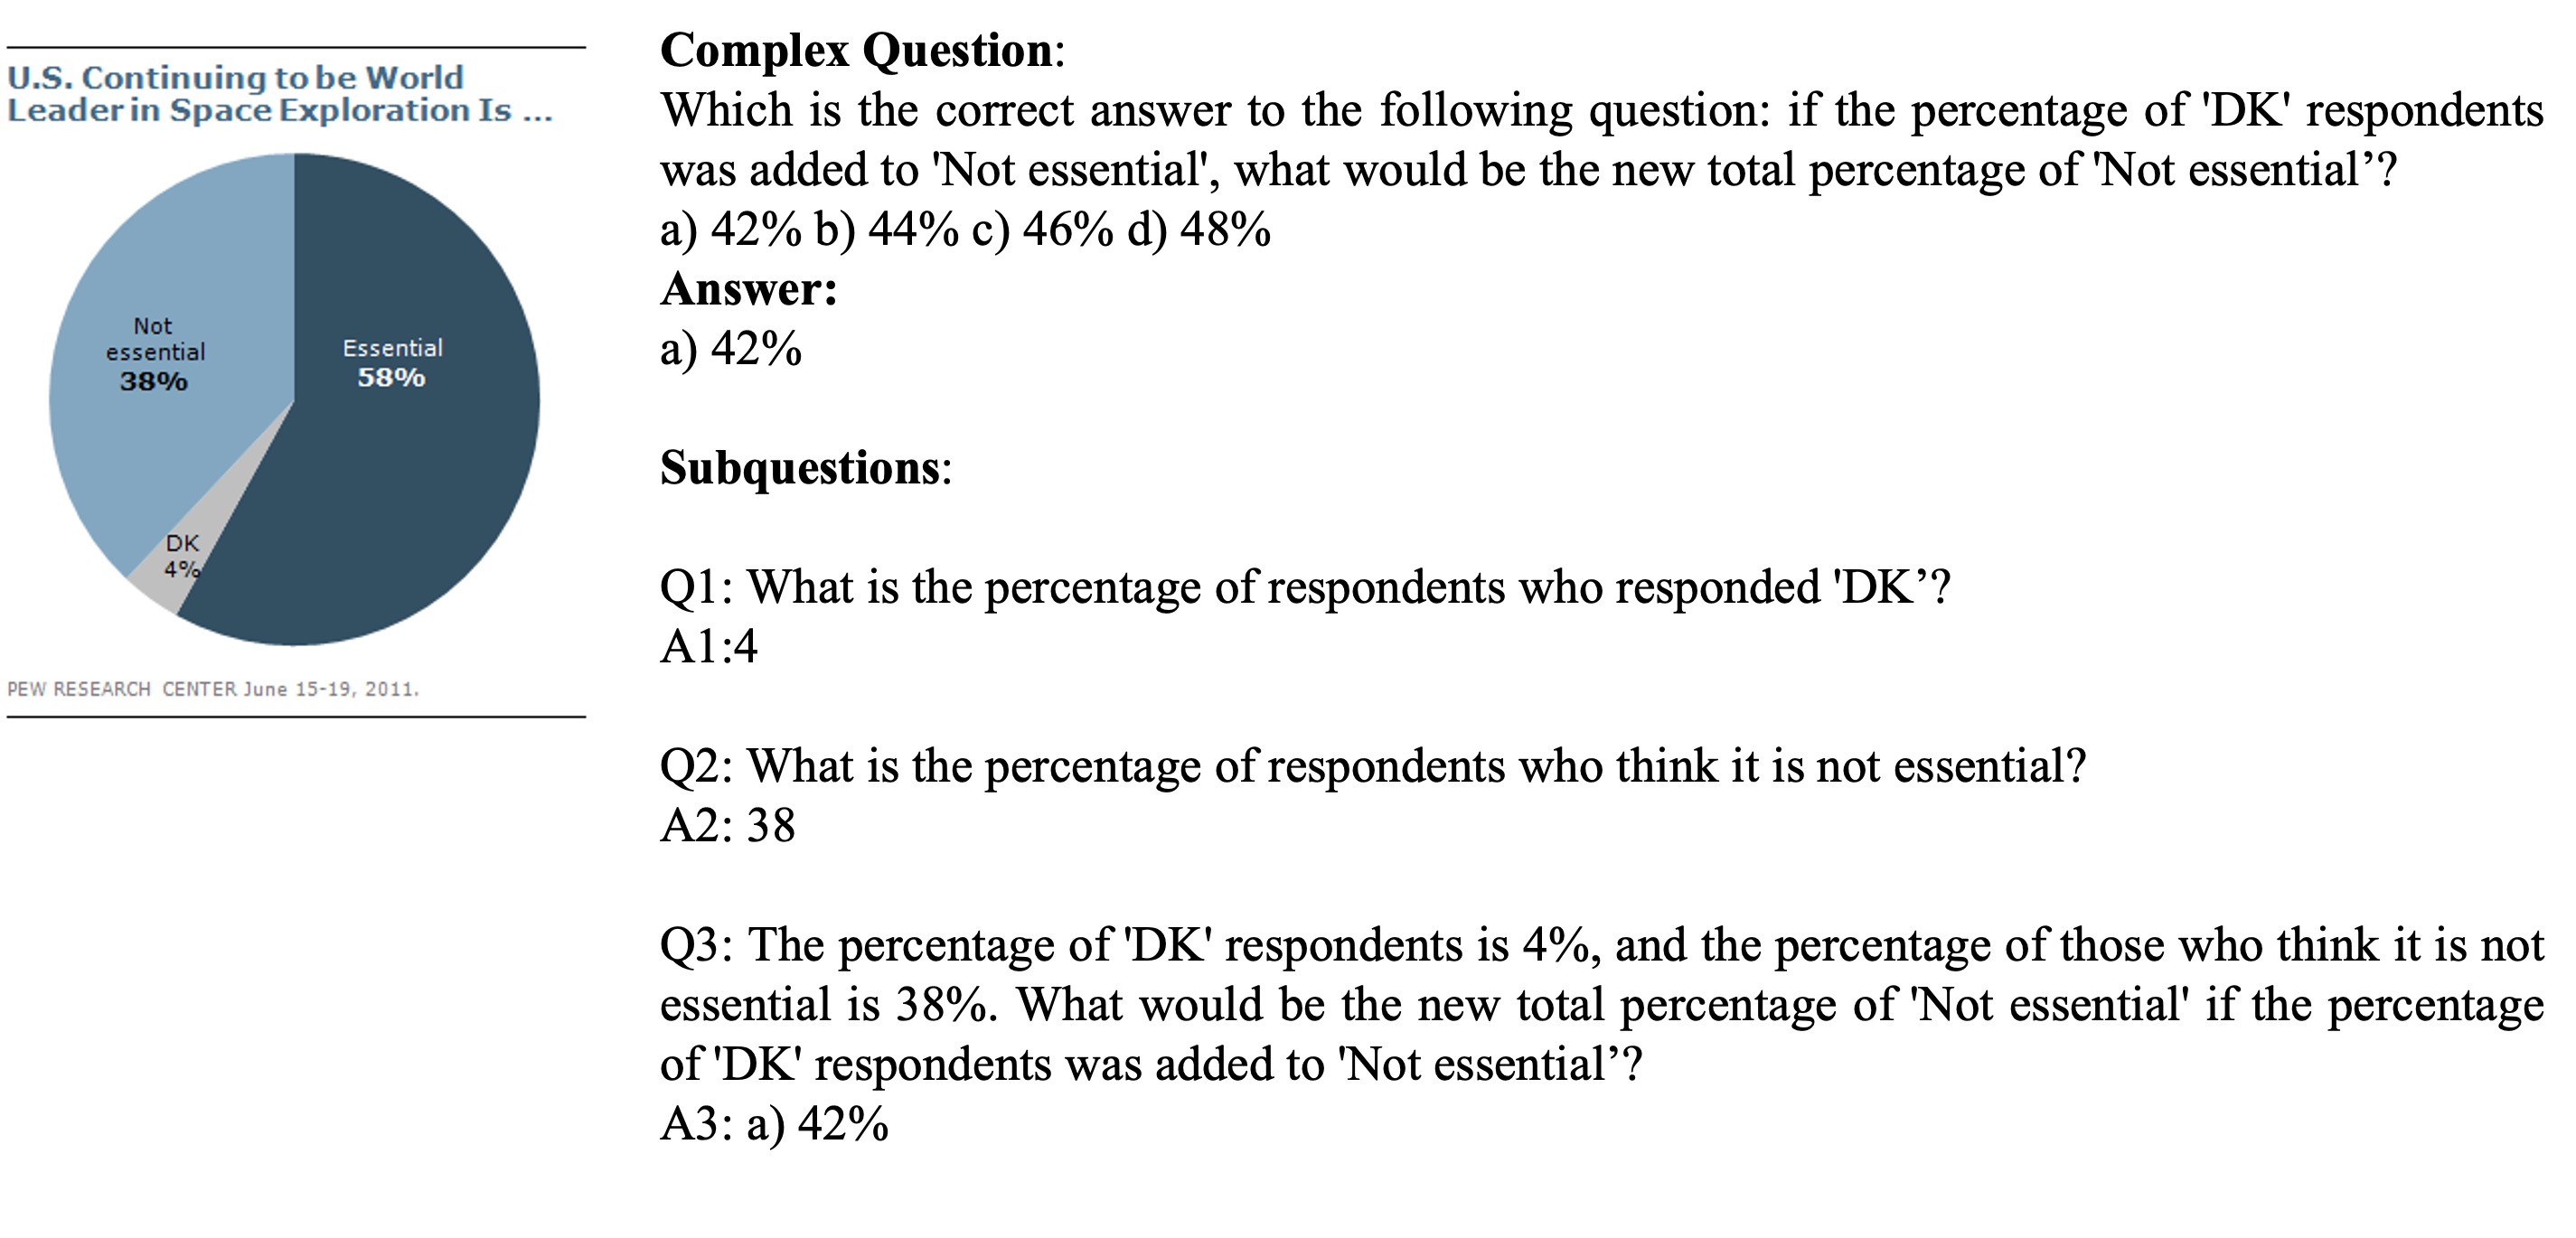
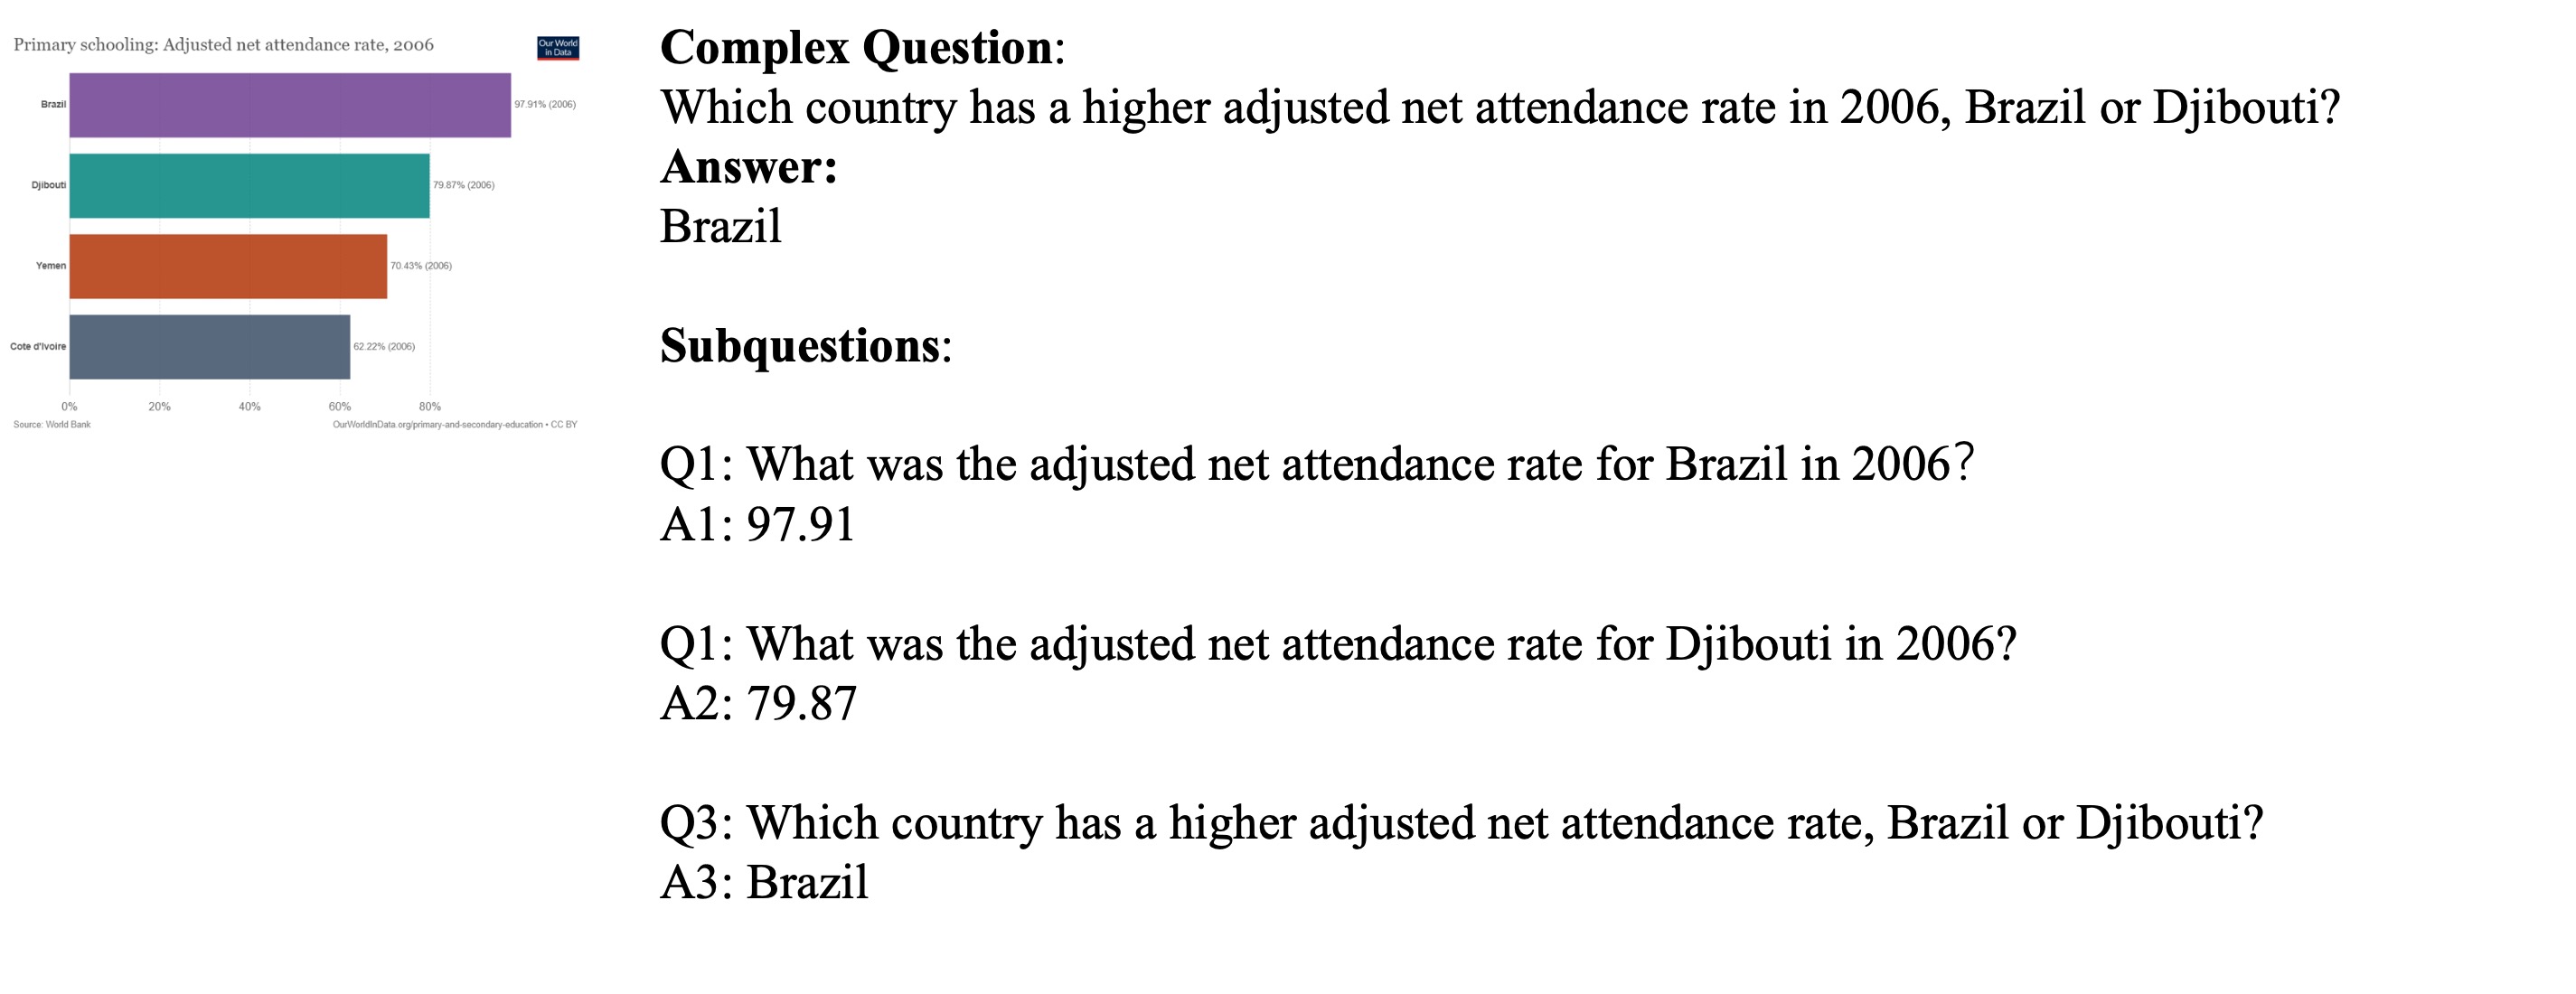
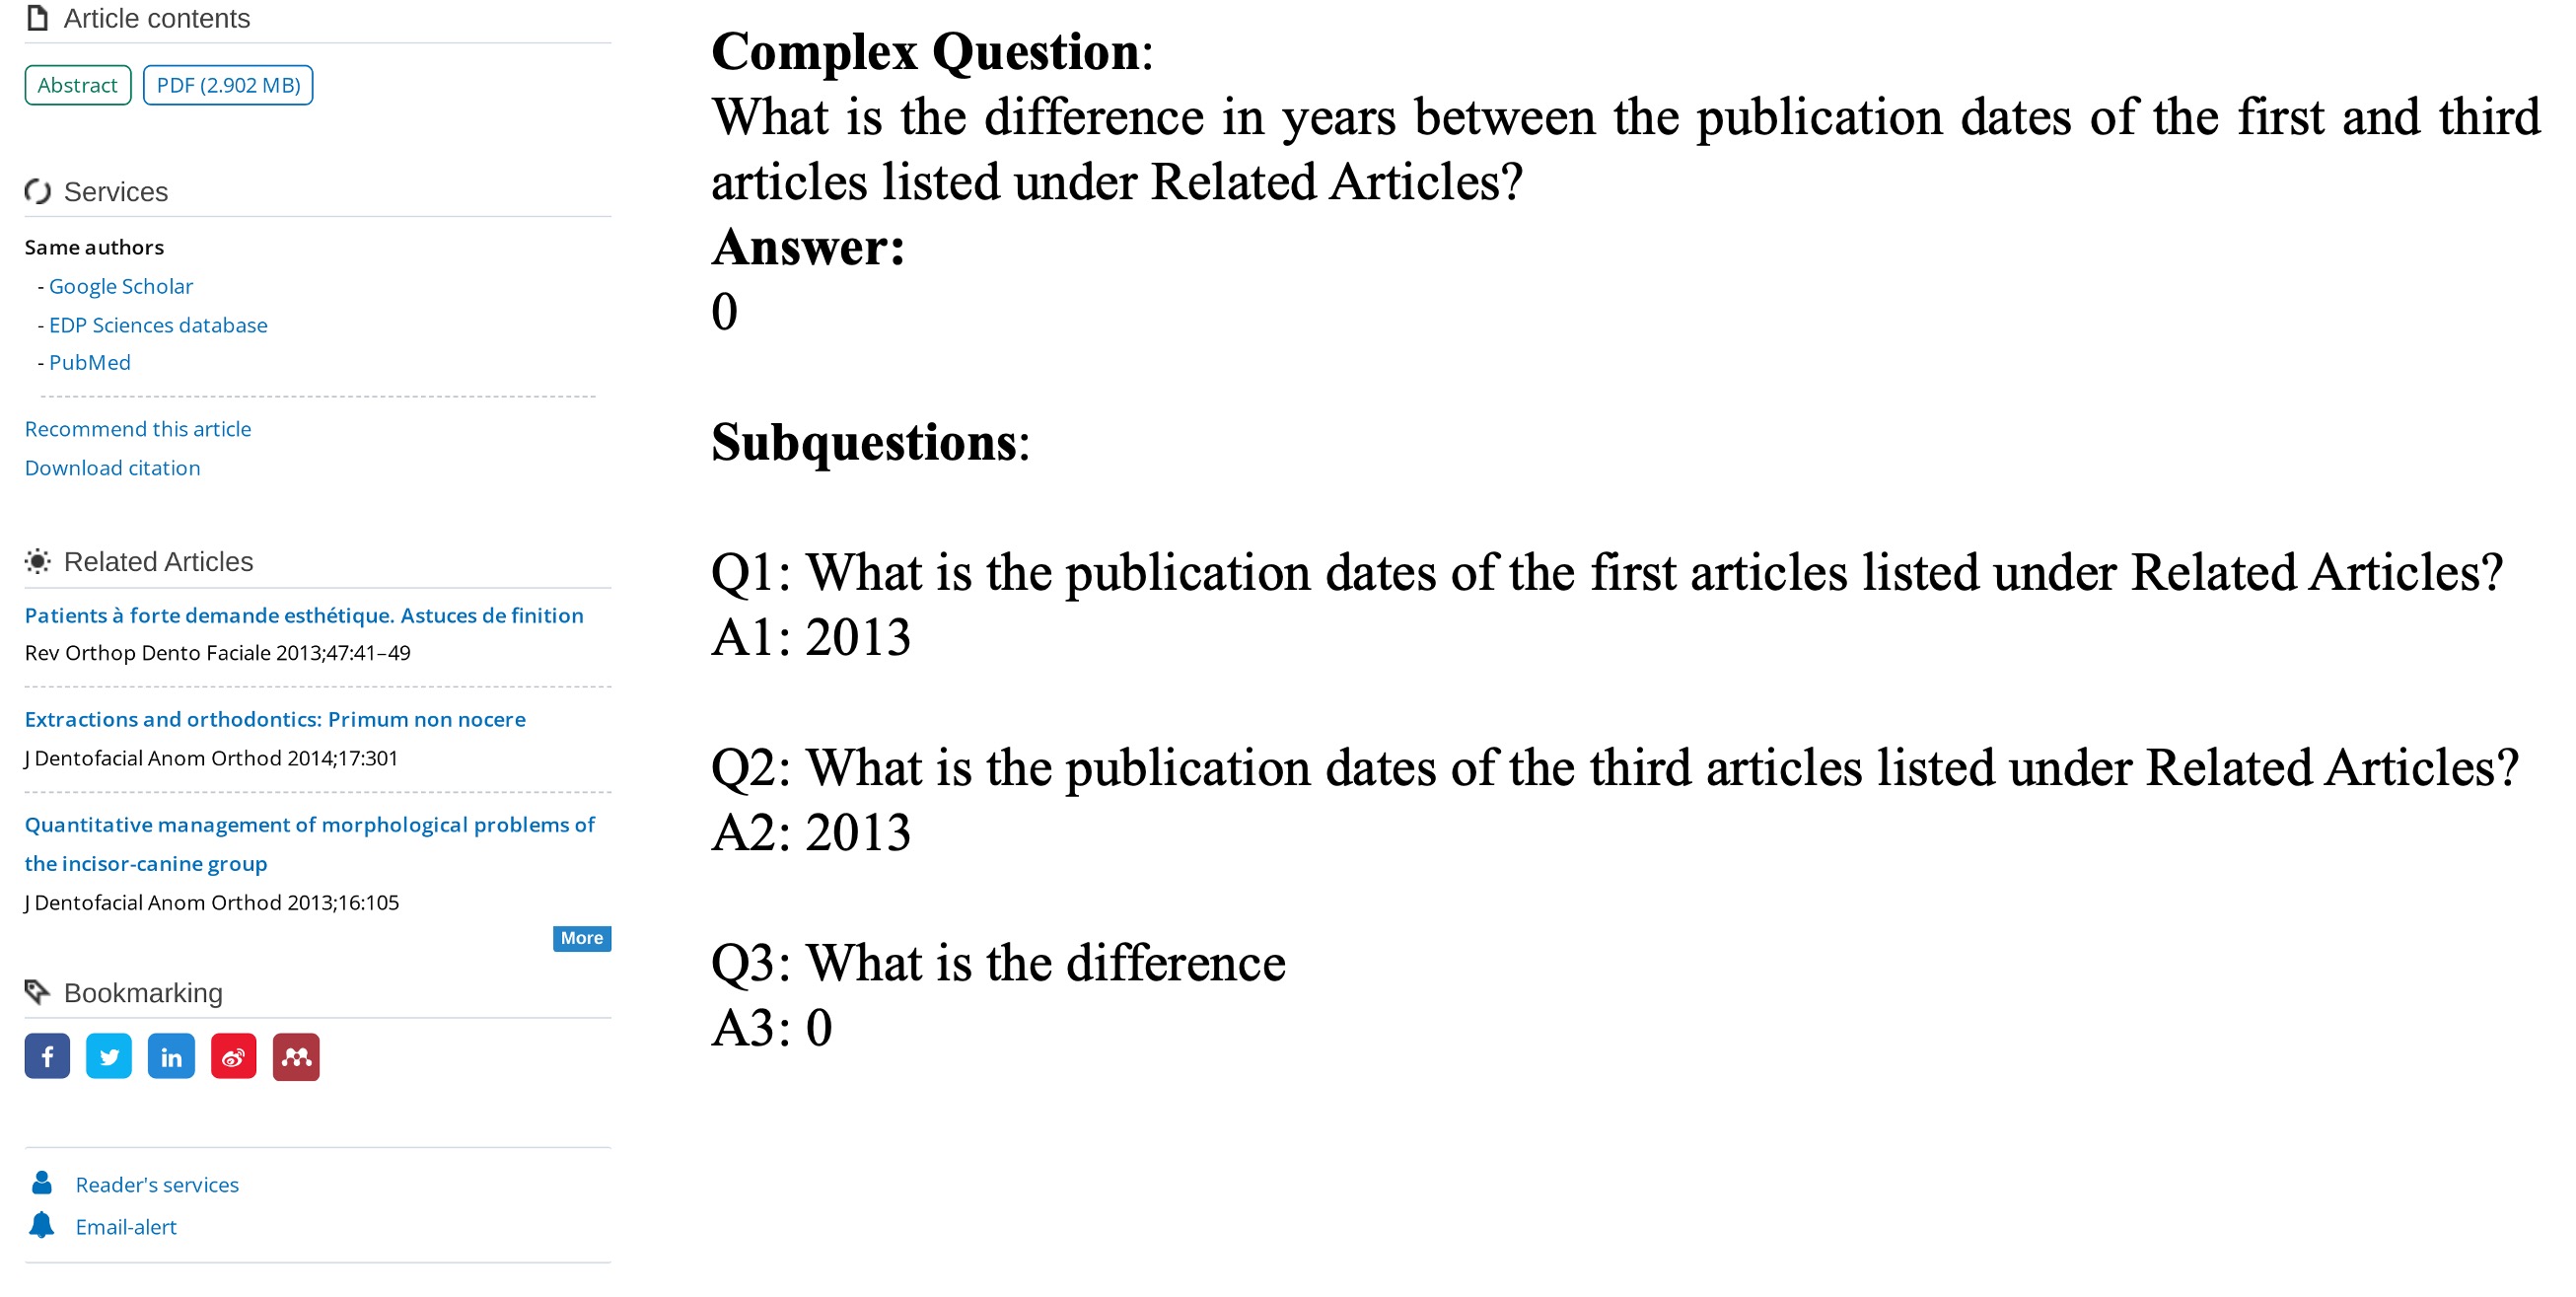
2) Question Generation via Factor Recomposition: given a new image and sampled factors from decomposed set, a multimodal LLM generates grounded subquestions, composes them into a complex question, and outputs both intermediate answer of subquestions and overall answers, enabling annotation-free data expansion;
3) Reinforcement Learning-Based Fine-tuning: we adopt GRPO to fine-tune a pretrained MLLM with the generated question–answer data. The structure of data generated COGS enables richer reward modeling beyond final-answer correctness.
We evaluate COGS across multiple artificial image domains and report results separately for each setting.
Chart Question Answering (CQA) requires interpreting visual representations in charts and reasoning over their spatial relation and underlying data. The recently released ChartQAPro benchmark consists of 1,948 human-curated question–answer pairs targeting complex reasoning over diverse chart types.
we randomly select 33% of the released test set as validation data and treat them as seed questions for data synthesis. The remaining 67% is held out as a fully unseen test set for all experiments. we use the training set of ChartQA as the image source.
| Model | Factoid | MCQ | Convers. | FactChk. | Hypoth. | Overall |
|---|---|---|---|---|---|---|
| Proprietary Models | ||||||
| GPT-5-nano | 45.95 | 63.64 | 49.40 | 63.58 | 49.82 | 50.74 |
| GPT-4o-mini | 43.63 | 66.43 | 45.48 | 59.88 | 45.20 | 48.32 |
| Gemini 2.5 Flash-Lite | 40.42 | 19.96 | 48.77 | 37.43 | 16.66 | 38.72 |
| Claude Haiku 3.5 | 43.44 | 65.03 | 39.84 | 61.79 | 38.77 | 46.74 |
| Opensource Models (7B+) | ||||||
| Qwen2.5-VL-7B (base) | 42.07 | 62.59 | 44.88 | 60.78 | 50.72 | 47.36 |
| InternVL3.5-GPT-OSS | 43.02 | 58.74 | 42.86 | 58.02 | 54.48 | 46.86 |
| Phi-4-14B | 23.18 | 34.27 | 40.93 | 46.91 | 36.31 | 31.61 |
| Chart Specialist Models | ||||||
| ChartLLaMA | 8.11 | 23.08 | 18.37 | 45.06 | 29.55 | 17.19 |
| ChartMoE | 19.03 | 35.66 | 32.97 | 45.68 | 27.08 | 27.28 |
| Prompting Strategies: over Qwen2.5-VL-7B | ||||||
| Self-Consistency | 43.44 | 61.54 | 44.00 | 59.82 | 41.76 | 47.22 |
| Tree of Thoughts | 40.01 | 57.94 | 41.55 | 54.13 | 53.35 | 44.44 |
| Decompositional CoT | 42.08 | 65.03 | 42.57 | 56.53 | 45.55 | 46.36 |
| Data Synthesis Approaches: over Qwen2.5-VL-7B | ||||||
| ChartQA-Train | 38.77 | 60.14 | 49.72 | 61.11 | 53.12 | 46.64 |
| Chart-R1 | 42.17 | 46.85 | 50.53 | 61.11 | 55.55 | 47.32 |
| In-Context Q Example | 46.33 | 62.94 | 46.91 | 61.11 | 61.72 | 50.58 |
| COGS (Ours) | 46.88 | 65.73 | 51.16 | 61.85 | 58.25 | 52.02 |
To demonstrate the generality of COGS, we also evaluate it on the webpage question answering domain, which requires visual, semantic, and structural reasoning over graphical user interfaces (GUIs). We adopt VisualWebBench, a benchmark consisting of diverse real-world webpages paired with reasoning-intensive, human-curated questions.
We use questions from VisualWebBench as seeds and screenshots from MultiUI as the image source.
| Model | WebQA |
|---|---|
| Proprietary Models | |
| GPT-5-nano | 89.47 |
| GPT-4o-mini | 81.34 |
| Gemini 2.5 Flash-Lite | 81.85 |
| Claude Haiku 3.5 | 80.86 |
| Opensource Models (~7B) | |
| Qwen2.5-VL-7B (base model) | 85.65 |
| InternVL3.5-GPT-OSS | 74.64 |
| Phi-4-14B | 74.16 |
| Specialist Models | |
| UiX-Qwen2 | 68.90 |
| Inference-time decomposition | |
| Decompositional CoT | 86.12 |
| Data Synthesis Approaches | |
| MultiUI-WQA | 86.60 |
| COGS (Ours) | 88.04 |
We extend COGS to a multi-dataset setting by incorporating the MultiModal Chart Benchmark (MMC-Bench).
We compare two strategies for synthesizing data across domains:
1. Data-level mixture: decompose and recompose A and B independently, then combine the synthesized data, i.e., Recompose(Decompose(A)) + Recompose(Decompose(B)).
2. Factor-level mixture: decompose A and B separately, merge all extracted factors into a joint pool, and recompose using this combined pool, i.e., Recompose(Decompose(A) ∪ Decompose(B)).
In addition, we include two "specialist models" trained only with augmented data from a single domain (e.g., trained on augmented A and evaluated on A). These serve as "upper-bound references" for in-domain data augmentation. All methods use Qwen2.5-VL-7B as the base model and are trained with GRPO and ProcessRM-max.
The results show that factor-level mixture is a better strategy for data mixing.
| Model | ChartQAPro | MMC |
|---|---|---|
| Qwen2.5VL | 47.36 | 85.65 |
| + ChartQAPro | 52.02 | 85.69 |
| + MMC | 49.93 | 88.10 |
| + Data-level Mix | 50.72 | 86.99 |
| + Factor-level Mix | 52.33 | 87.55 |
We ablate 3 reward models.
Theoretical proof* and empirical results show that ProcessRM-max is the most effective reward model in the setting of COGS.
*Please find more details in our paper.
| Reward Model | Overall Accuracy |
|---|---|
| StandardRM | 50.96 |
| ProcessRM-sum | 50.35 |
| ProcessRM-max | 52.02 |


@misc{gu2025compositiongroundedinstructionsynthesisvisual,
  title={Composition-Grounded Instruction Synthesis for Visual Reasoning},
  author={Xinyi Gu and Jiayuan Mao and Zhang-Wei Hong and
    Zhuoran Yu and Pengyuan Li and Dhiraj Joshi and
    Rogerio Feris and Zexue He},
  year={2025},
  eprint={2510.15040},
  archivePrefix={arXiv},
  primaryClass={cs.CV},
  url={https://arxiv.org/abs/2510.15040},
}